
- Home >
- Stock Photos >
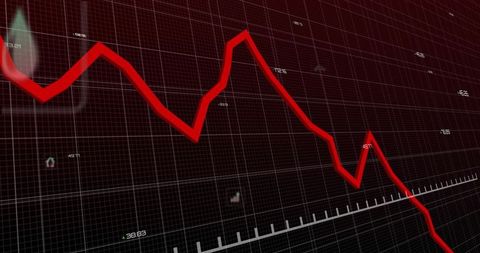
- Declining Financial Graph on Dark Screen Amid Data Points
Declining Financial Graph on Dark Screen Amid Data Points Image
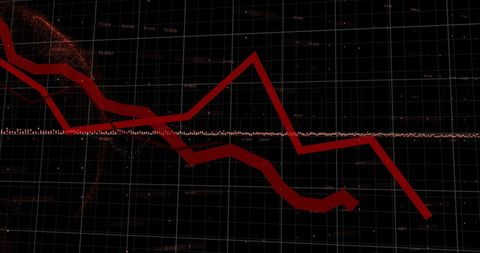
Illustrating a significant decline in economic performance with a bold red graph over a black digital background. Ideal for articles or presentations discussing market downturns, financial crises, or economic forecasts. Useful in educational materials focusing on finance or economic studies.
Powered by 


downloads
Tags:
More
Credit Photo
If you would like to credit the Photo, here are some ways you can do so
Text Link
photo Link
<span class="text-link">
<span>
<a target="_blank" href=https://pikwizard.com/photo/declining-financial-graph-on-dark-screen-amid-data-points/bf20bca4d317382ab97fa3642b5b4fd9/>PikWizard</a>
</span>
</span>
<span class="image-link">
<span
style="margin: 0 0 20px 0; display: inline-block; vertical-align: middle; width: 100%;"
>
<a
target="_blank"
href="https://pikwizard.com/photo/declining-financial-graph-on-dark-screen-amid-data-points/bf20bca4d317382ab97fa3642b5b4fd9/"
style="text-decoration: none; font-size: 10px; margin: 0;"
>
<img src="https://pikwizard.com/pw/medium/bf20bca4d317382ab97fa3642b5b4fd9.jpg" style="margin: 0; width: 100%;" alt="" />
<p style="font-size: 12px; margin: 0;">PikWizard</p>
</a>
</span>
</span>
Free (free of charge)
Free for personal and commercial use.
Author: Awesome Content
Similar Free Stock Images

Premium


Premium


Premium


Premium

Premium


Premium


Premium

Premium

Premium


Premium

Premium


Premium


Premium


Premium


Premium
Premium

Premium


Premium


Premium


Premium


Premium


Premium

Premium


Premium


Premium


Explore More Free Stock Images