- Home >
- Stock Photos >
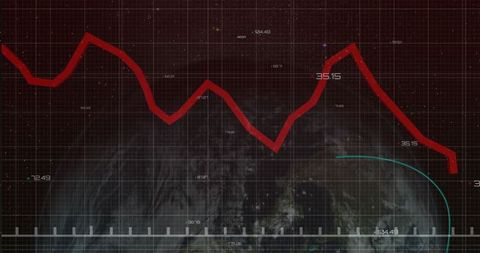
- Declining Financial Graph Over Data Grid with Global Background
Declining Financial Graph Over Data Grid with Global Background Image

This digital illustration shows a downward-trending financial graph overlaid on a grid with bright data points, representing global financial trends. Suitable for editorial pieces on market performance, economic analysis reports, investment risk assessment, or as a visual aid in financial presentations.

downloads
Tags:
More
Credit Photo
If you would like to credit the Photo, here are some ways you can do so
Text Link
photo Link
<span class="text-link">
<span>
<a target="_blank" href=https://pikwizard.com/photo/declining-financial-graph-over-data-grid-with-global-background/e9bad74d60dd0e353282c952e5f6f4ab/>PikWizard</a>
</span>
</span>
<span class="image-link">
<span
style="margin: 0 0 20px 0; display: inline-block; vertical-align: middle; width: 100%;"
>
<a
target="_blank"
href="https://pikwizard.com/photo/declining-financial-graph-over-data-grid-with-global-background/e9bad74d60dd0e353282c952e5f6f4ab/"
style="text-decoration: none; font-size: 10px; margin: 0;"
>
<img src="https://pikwizard.com/pw/medium/e9bad74d60dd0e353282c952e5f6f4ab.jpg" style="margin: 0; width: 100%;" alt="" />
<p style="font-size: 12px; margin: 0;">PikWizard</p>
</a>
</span>
</span>
Free (free of charge)
Free for personal and commercial use.
Author: Awesome Content