- Home >
- Stock Photos >
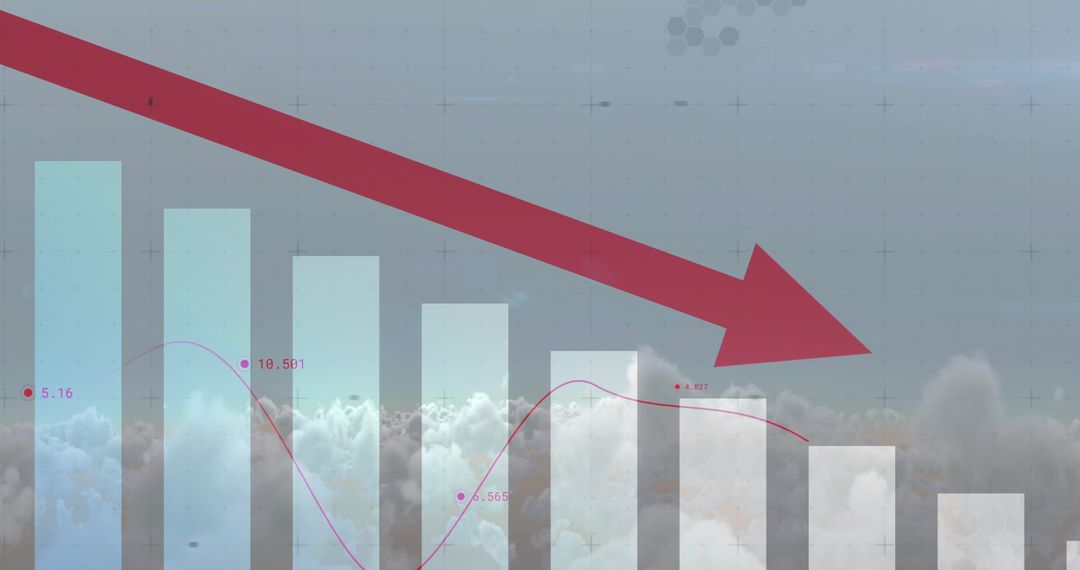
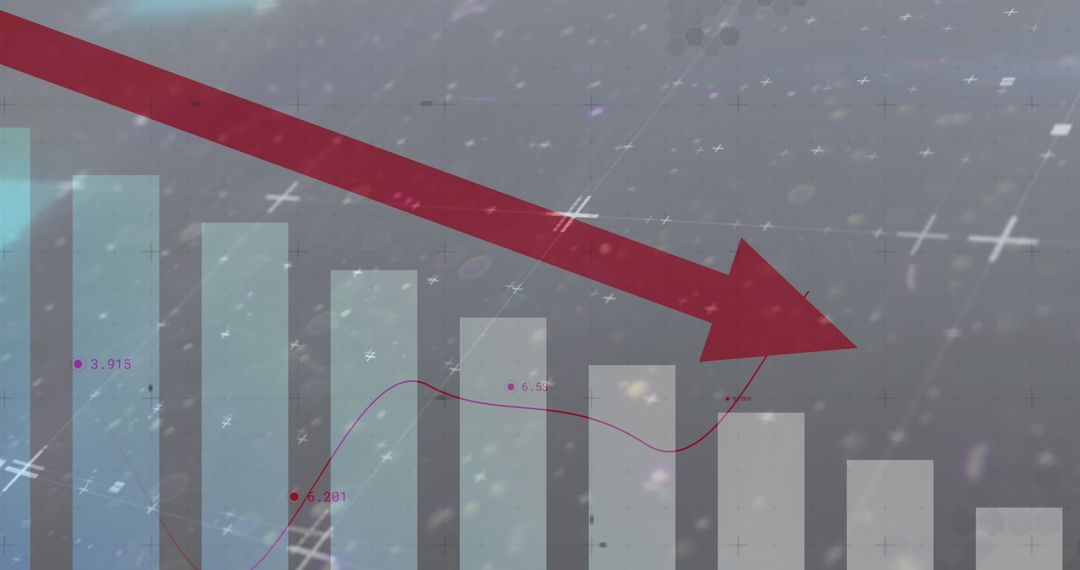
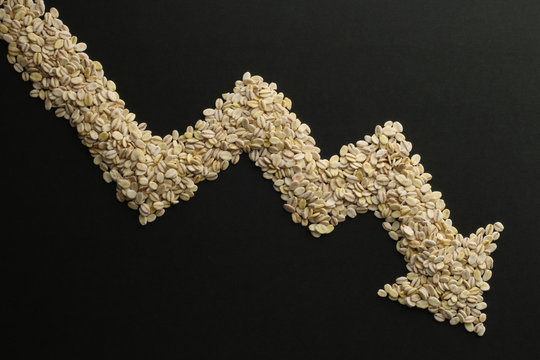
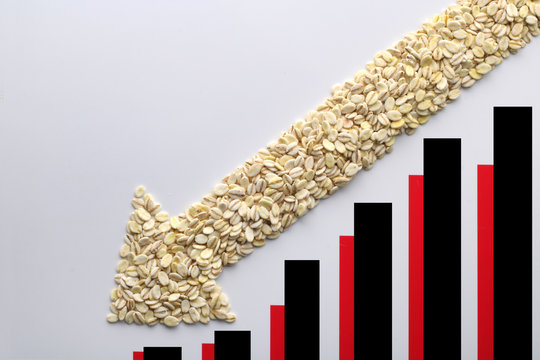
- Declining Financial Graph with Red Arrow and Data Analysis
Declining Financial Graph with Red Arrow and Data Analysis Image

Vivid illustration of financial statistics featuring a striking red arrow indicating a downturn on a blue-toned bar chart. Users interested in financial markets can utilize this for presentations about economic performance or forecasts, educational materials on market analysis, or articles on financial challenges.
Powered by 


2
downloads
downloads
Tags:
More
Credit Photo
If you would like to credit the Photo, here are some ways you can do so
Text Link
photo Link
<span class="text-link">
<span>
<a target="_blank" href=https://pikwizard.com/photo/declining-financial-graph-with-red-arrow-and-data-analysis/5274d28d41bb918d676108321b31f811/>PikWizard</a>
</span>
</span>
<span class="image-link">
<span
style="margin: 0 0 20px 0; display: inline-block; vertical-align: middle; width: 100%;"
>
<a
target="_blank"
href="https://pikwizard.com/photo/declining-financial-graph-with-red-arrow-and-data-analysis/5274d28d41bb918d676108321b31f811/"
style="text-decoration: none; font-size: 10px; margin: 0;"
>
<img src="https://pikwizard.com/pw/medium/5274d28d41bb918d676108321b31f811.jpg" style="margin: 0; width: 100%;" alt="" />
<p style="font-size: 12px; margin: 0;">PikWizard</p>
</a>
</span>
</span>
Free (free of charge)
Free for personal and commercial use.
Author: Creative Art
Similar Free Stock Images

Premium


Premium


Premium


Premium


Premium


Premium


Premium


Premium


Premium


Premium


Premium


Premium


Premium


Premium


Premium


Premium


Premium


Premium


Premium


Premium


Premium


Premium