
- Home >
- Stock Photos >
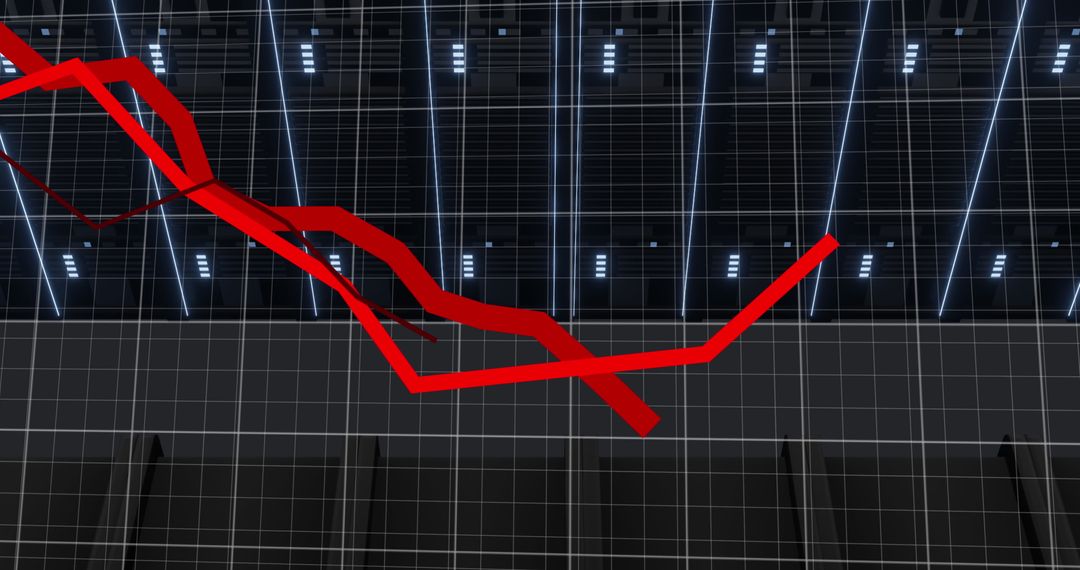
- Declining Financial Trends with Red Graph Lines on Grid
Declining Financial Trends with Red Graph Lines on Grid Image

Graphic depicting a sharp decline in financial values using red lines on a gridded background, often indicative of recession or negative economic shifts. Useful for illustrating articles and presentations on stock market volatility, financial troubles, economic downturns, and investment strategies. It vividly conveys the direction of financial movements, making it suitable for use in both online and print media discussing current financial events.
Powered by  - Get 15% off with code: PIKWIZARD15


2
downloads
downloads
Tags:
More
Credit Photo
If you would like to credit the Photo, here are some ways you can do so
Text Link
photo Link
<span class="text-link">
<span>
<a target="_blank" href=https://pikwizard.com/photo/declining-financial-trends-with-red-graph-lines-on-grid/e5fafd26a916bab1c3e07924aace8574/>PikWizard</a>
</span>
</span>
<span class="image-link">
<span
style="margin: 0 0 20px 0; display: inline-block; vertical-align: middle; width: 100%;"
>
<a
target="_blank"
href="https://pikwizard.com/photo/declining-financial-trends-with-red-graph-lines-on-grid/e5fafd26a916bab1c3e07924aace8574/"
style="text-decoration: none; font-size: 10px; margin: 0;"
>
<img src="https://pikwizard.com/pw/medium/e5fafd26a916bab1c3e07924aace8574.jpg" style="margin: 0; width: 100%;" alt="" />
<p style="font-size: 12px; margin: 0;">PikWizard</p>
</a>
</span>
</span>
Free (free of charge)
Free for personal and commercial use.
Author: Awesome Content
Similar Free Stock Images

Premium


Premium


Premium


Premium


Premium


Premium


Premium


Premium


Premium


Premium


Premium


Premium


Premium


Premium


Premium


Premium


Premium


Premium


Premium


Premium


Premium


Premium


Premium


Premium

