- Home >
- Stock Photos >
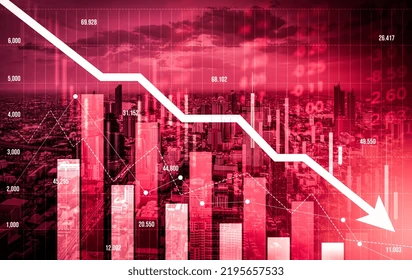
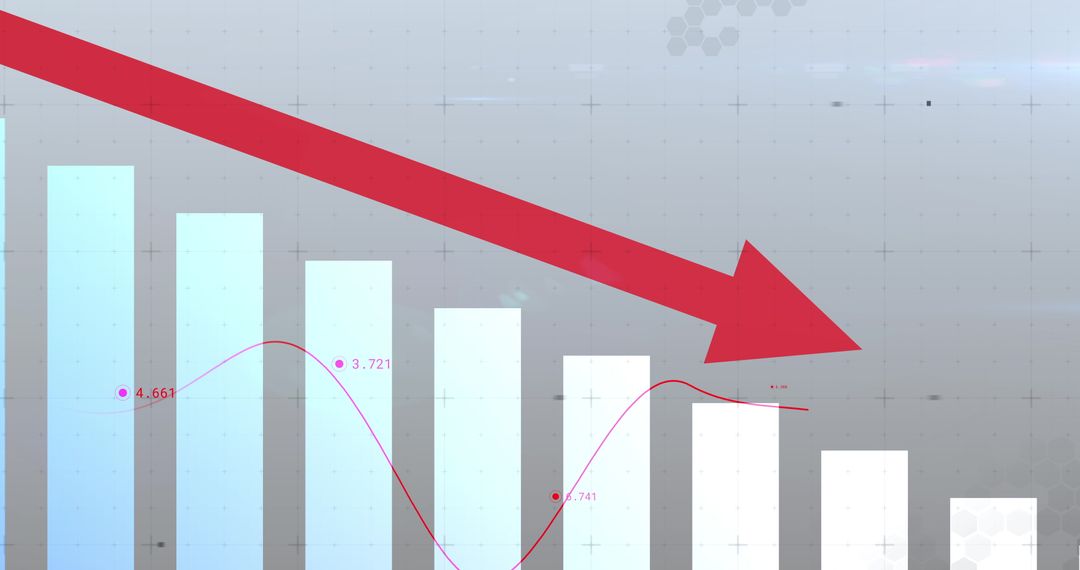
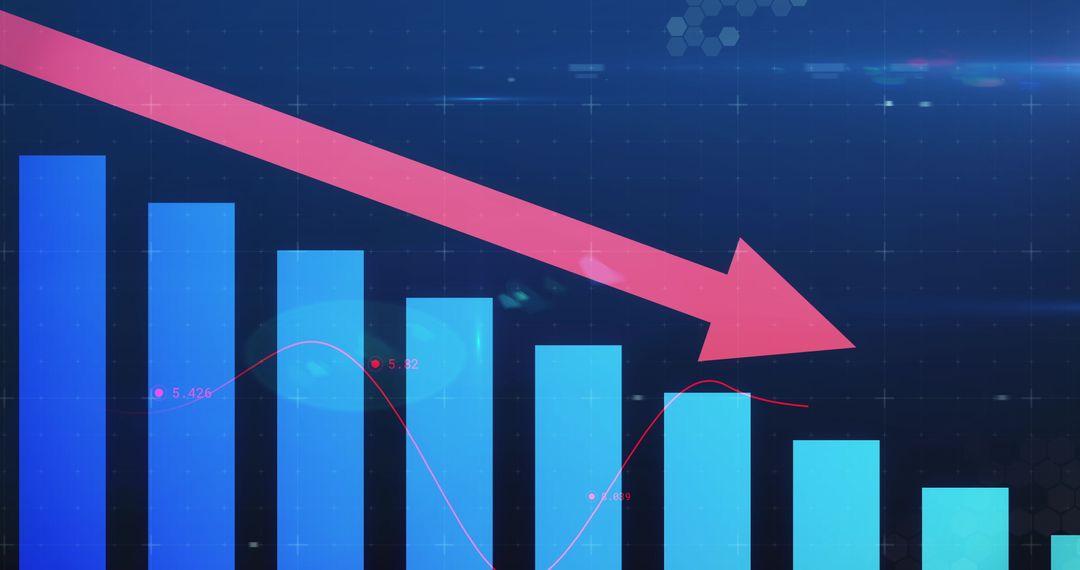
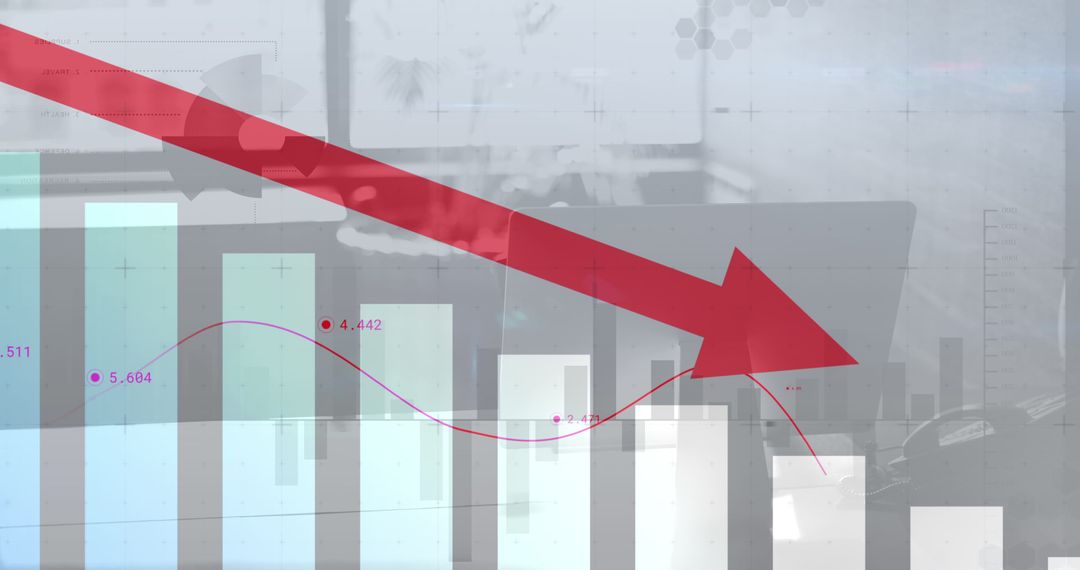
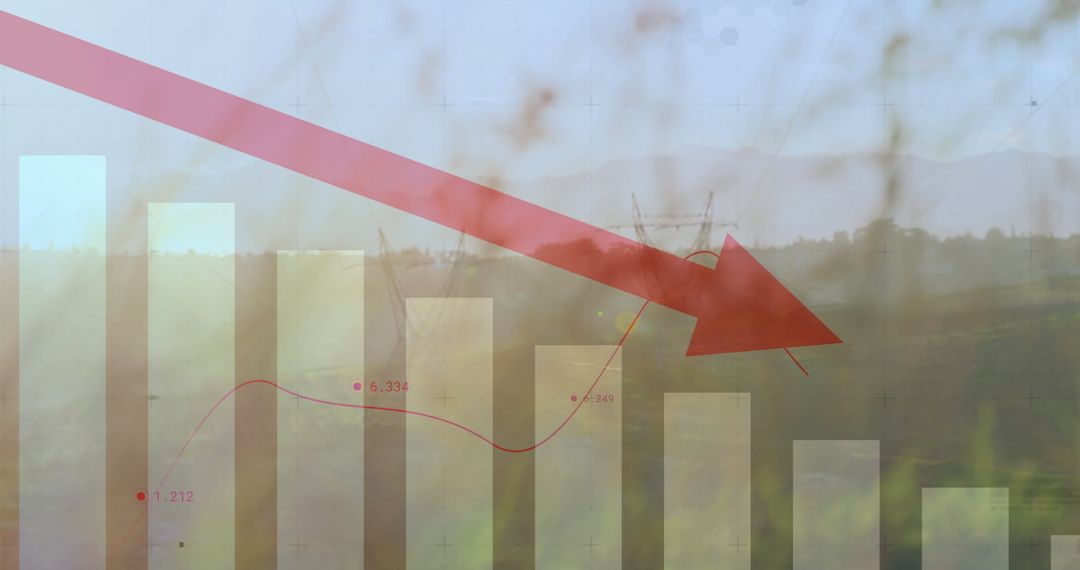
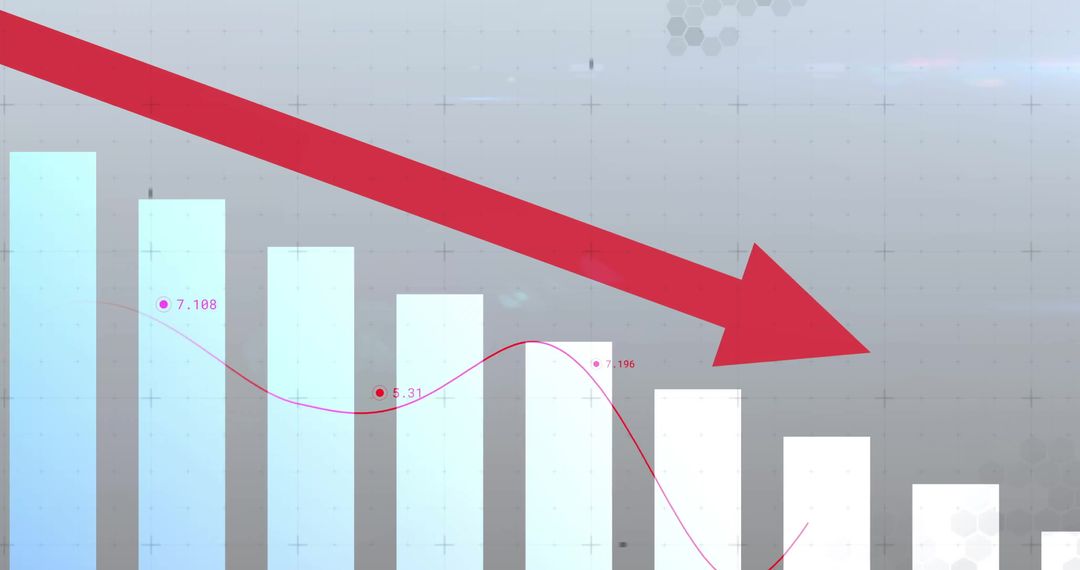
- Declining Graph and Arrow Indicate Financial Downtrend
Declining Graph and Arrow Indicate Financial Downtrend Image

Chart displays downward movement, useful for illustrating economic decline, market recession, business risk analysis, or financial reports. Ideal for articles, presentations, or discussions on fiscal challenges.
Powered by  - Get 15% off with code: PIKWIZARD15


4
downloads
downloads
Tags:
More
Credit Photo
If you would like to credit the Photo, here are some ways you can do so
Text Link
photo Link
<span class="text-link">
<span>
<a target="_blank" href=https://pikwizard.com/photo/declining-graph-and-arrow-indicate-financial-downtrend/ca751976b83850540a6ed5b2d2c0b9b4/>PikWizard</a>
</span>
</span>
<span class="image-link">
<span
style="margin: 0 0 20px 0; display: inline-block; vertical-align: middle; width: 100%;"
>
<a
target="_blank"
href="https://pikwizard.com/photo/declining-graph-and-arrow-indicate-financial-downtrend/ca751976b83850540a6ed5b2d2c0b9b4/"
style="text-decoration: none; font-size: 10px; margin: 0;"
>
<img src="https://pikwizard.com/pw/medium/ca751976b83850540a6ed5b2d2c0b9b4.jpg" style="margin: 0; width: 100%;" alt="" />
<p style="font-size: 12px; margin: 0;">PikWizard</p>
</a>
</span>
</span>
Free (free of charge)
Free for personal and commercial use.
Author: Authentic Images
Similar Free Stock Images

Premium


Premium


Premium


Premium


Premium


Premium


Premium


Premium


Premium


Premium


Premium


Premium


Premium


Premium


Premium


Premium


Premium


Premium


Premium


Premium


Premium


Premium


Premium


Premium