
- Home >
- Stock Photos >
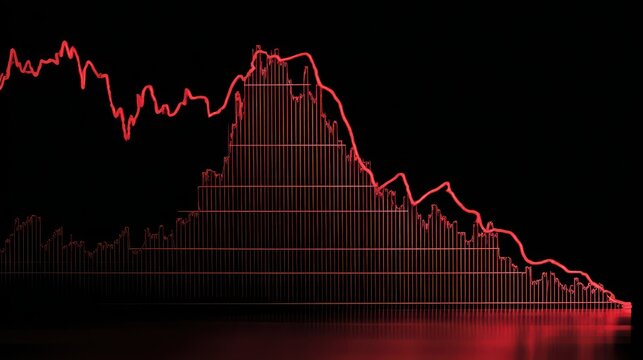
- Declining Graph Illustrating Business Loss and Reduction Concept
Declining Graph Illustrating Business Loss and Reduction Concept Image

Visual representation of economic loss in business. Graph in red line against grid and gradient background symbolizes declining trends and market analysis, ideal for presentations on financial records, economy reports, and stock market insights.
Powered by 


3
downloads
downloads
Tags:
More
Credit Photo
If you would like to credit the Photo, here are some ways you can do so
Text Link
photo Link
<span class="text-link">
<span>
<a target="_blank" href=https://pikwizard.com/photo/declining-graph-illustrating-business-loss-and-reduction-concept/a8d46304cef9a42e064b8880e758158d/>PikWizard</a>
</span>
</span>
<span class="image-link">
<span
style="margin: 0 0 20px 0; display: inline-block; vertical-align: middle; width: 100%;"
>
<a
target="_blank"
href="https://pikwizard.com/photo/declining-graph-illustrating-business-loss-and-reduction-concept/a8d46304cef9a42e064b8880e758158d/"
style="text-decoration: none; font-size: 10px; margin: 0;"
>
<img src="https://pikwizard.com/pw/medium/a8d46304cef9a42e064b8880e758158d.jpg" style="margin: 0; width: 100%;" alt="" />
<p style="font-size: 12px; margin: 0;">PikWizard</p>
</a>
</span>
</span>
Free (free of charge)
Free for personal and commercial use.
Author: Creative Art
Similar Free Stock Images

Premium


Premium


Premium


Premium


Premium


Premium


Premium


Premium


Premium


Premium


Premium


Premium


Premium


Premium


Premium


Premium


Premium


Premium


Premium


Premium


Premium


Premium


Premium


Premium

