
- Home >
- Stock Photos >
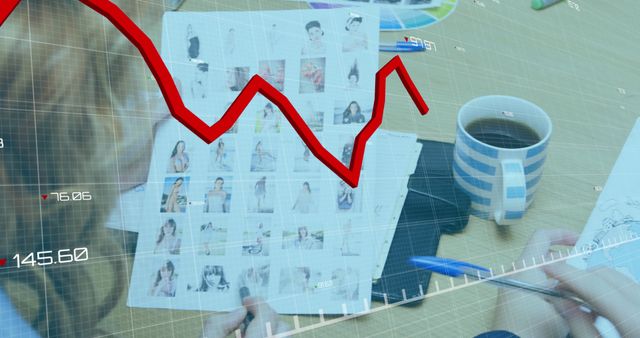
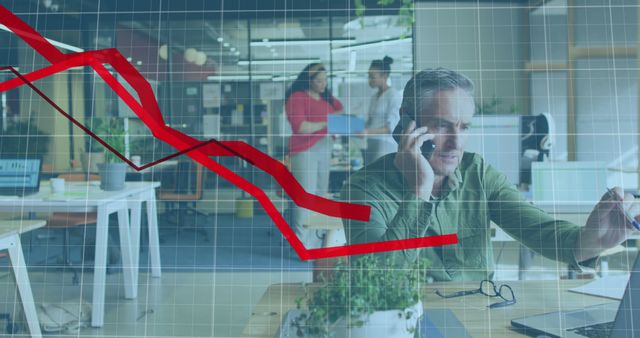
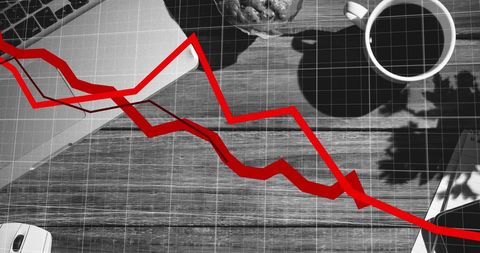
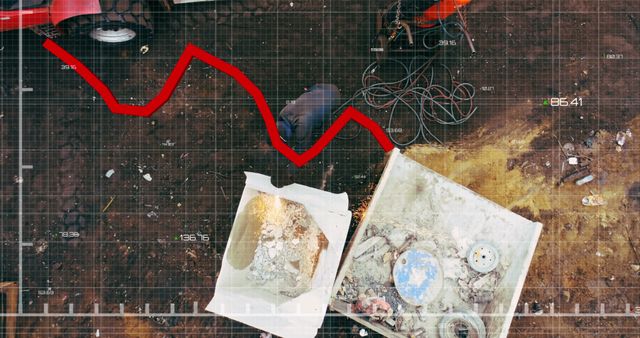
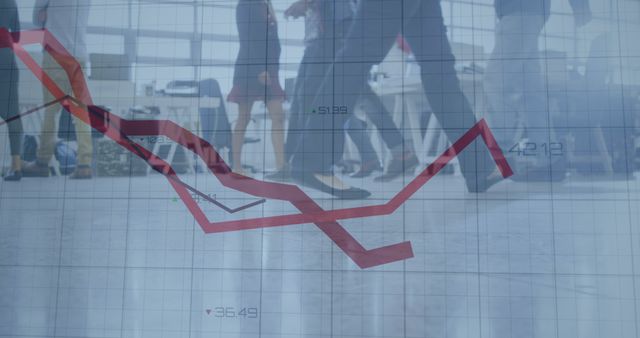
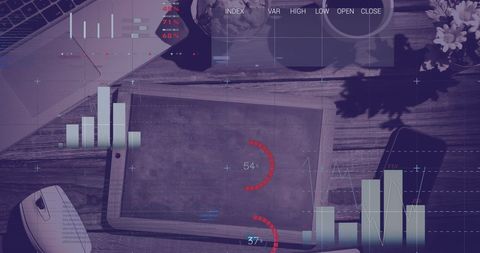
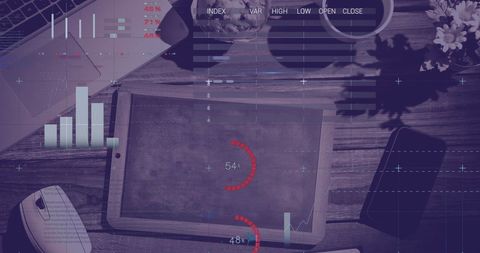
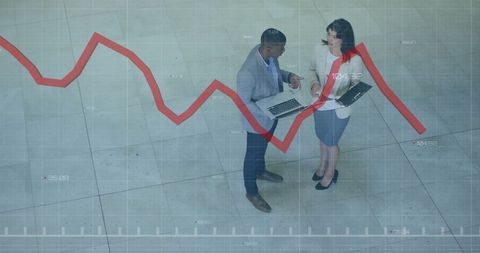
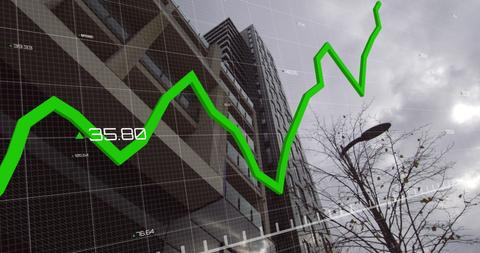
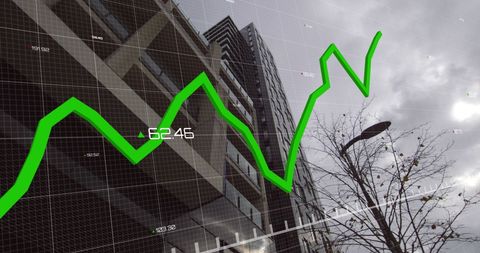
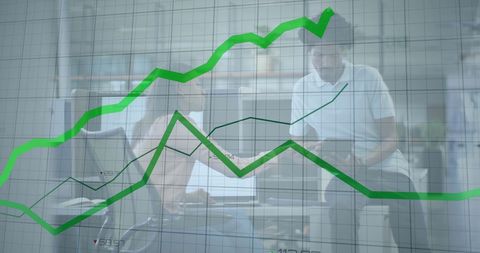
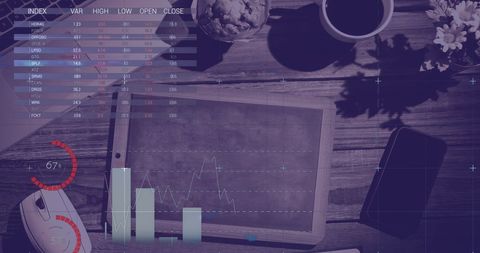
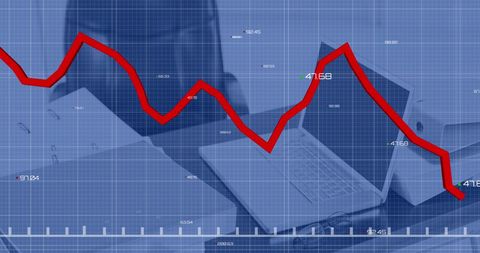
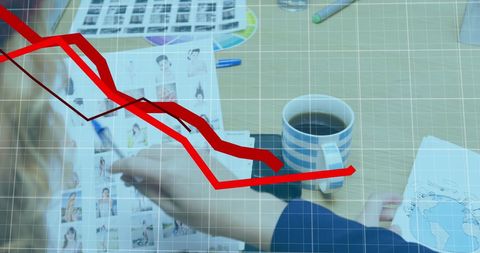
- Declining Graph Over Desk Analyzing Financial Trends at Work
Declining Graph Over Desk Analyzing Financial Trends at Work Image
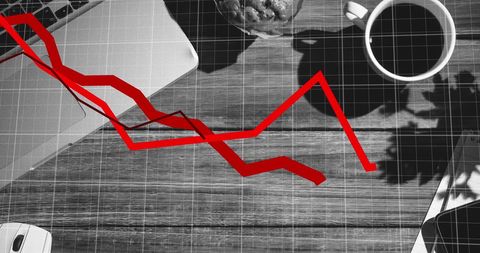
Collaborative work environments can use this representation of declining financial trends for reports and presentations. The image symbolizes the pressures of tracking the economy and changing markets, resonating with finance professionals, business analysts, and companies aiming to visualize data shifts.
Powered by  - Get 15% off with code: PIKWIZARD15


downloads
Tags:
More
Credit Photo
If you would like to credit the Photo, here are some ways you can do so
Text Link
photo Link
<span class="text-link">
<span>
<a target="_blank" href=https://pikwizard.com/photo/declining-graph-over-desk-analyzing-financial-trends-at-work/1776bea85bd04bc7f18e7dee4a6d9be3/>PikWizard</a>
</span>
</span>
<span class="image-link">
<span
style="margin: 0 0 20px 0; display: inline-block; vertical-align: middle; width: 100%;"
>
<a
target="_blank"
href="https://pikwizard.com/photo/declining-graph-over-desk-analyzing-financial-trends-at-work/1776bea85bd04bc7f18e7dee4a6d9be3/"
style="text-decoration: none; font-size: 10px; margin: 0;"
>
<img src="https://pikwizard.com/pw/medium/1776bea85bd04bc7f18e7dee4a6d9be3.jpg" style="margin: 0; width: 100%;" alt="" />
<p style="font-size: 12px; margin: 0;">PikWizard</p>
</a>
</span>
</span>
Free (free of charge)
Free for personal and commercial use.
Author: Awesome Content
Similar Free Stock Images
Premium
Premium

Premium

Premium


Premium


Premium

Premium


Premium


Premium

Premium

Premium


Premium


Premium


Premium


Premium


Premium

Premium


Premium


Premium

Premium


Premium


Premium


Premium


Premium


Premium

Explore More Free Stock Images