1. Home > 
  2. Stock Photos > 
  3. Declining Graph Showing Market Trends

Declining Graph Showing Market Trends Image

Declining Graph Showing Market Trends

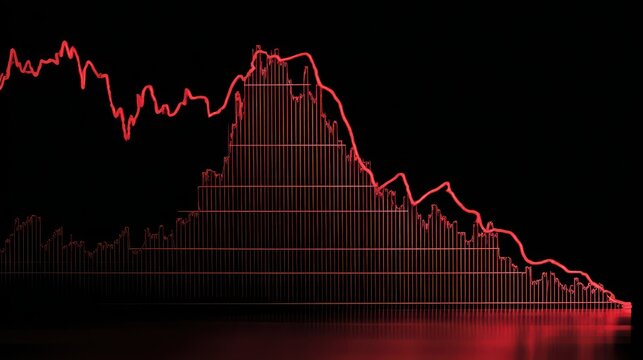
This visualization of declining graph with red lines and numbers on a dark background depicting financial data is ideal for use in presentations, articles about market trends, economic analyses, or educational materials explaining stock market fluctuations. It effectively communicates shifts in market conditions, suitable for visual content on websites discussing financial and economic topics.

Powered by Adobe logo
Financial data display - Powered by AdobeBlue stock trading graph with glowing neon line and text chart finance - Powered by AdobeFinancial stock market graph showing candlestick charts and line graphs on a dark blue background, representing investment, trading, and economic data analysis for business growth and decline - Powered by AdobeRed arrow plummeting over miniature cityscape; stock market crash or economic downturn - Powered by AdobeHand interacting with financial data on a digital screen showing stock market graphs - Powered by Adobe

Credit Photo

If you would like to credit the Photo, here are some ways you can do so

Free (free of charge)

Free for personal and commercial use.

Author: Awesome Content

Similar Free Stock Images

Red Declining Graph on Digital Grid Display Represents Falling Markets
Premium
Abstract financial chart overlayed on a blurred mountain range
Digital Financial Graph Overlapping Modern Cityscape
Futuristic Digital Data with Circuit Animations on Blue Background
Red Economy Chart Displays Market Downturn Digital Background
Data Analytics Graph and Technology Interface
Premium
Abstract financial data visualization. Night city lights blur
Financial Data Visualization with Line and Bar Graphs
Rising Graphs and Interactive Financial Data Analytics Background
Dynamic Financial Graphs Illustrating Market Trends and Data
Visualizing Trends in Financial Data with Code and Graphs
Premium
Red and yellow financial graph descending against blue background with bokeh lights stock market trading
Dynamic Financial Growth Graph on Blue Grid Background
Dynamic Financial Figures and Pattern on Black Background
Futuristic 3D Graph Illustration with Data Overlay
Binary Code Overlaying Red Financial Graph Indicating Market Decline Performance
Premium
Businessman analyzing financial chart showing declining profits and rising costs with digital overlay
Digital Fingerprint Overlayed on Financial Data Illustrating Cybersecurity
Dynamic Financial Data Chart on Blue Background
Global Financial Data Processing with Digital Interface Elements
Digital Financial Data and Network Connections Visual
Premium
Close-up macro shot of a financial candlestick chart displaying data fluctuation and movement with orange and blue bars against a dark blue background for stock trading or cryptocurrency exchange.
Green Bar Graph and Rising Line Graph Depicting Data Analysis
Dynamic Display of Financial Market Data on Advanced Grid
Digital Data Analytics Growth Trend with Graphs
Dynamic Stock Market Trends and Financial Data Graph
Premium
Two glowing spheres with financial graphs inside balance on a seesaw, representing comparison and equilibrium in data or market analysis.
Dynamic Financial Graphs on Gradient Red Background
Green Line Graph with Vertical Bars for Data Analysis
Red Trend Line Fluctuating on Digital Chart Grid
Financial Market Analysis Dashboard with Graphs and Charts
Red Graph Falling over Black and White Office Background
Digital Financial Data with Trending Arrows
Premium
Stock Market Analysis with Upward Trend finance graph
Financial Data Analysis Over Cityscape Graph
Stock Market Volatility Reflected in Declining Red Graph
Green Line Graph on Bar Chart Representing Financial Growth
Global Finance and Technology Concept with Dynamic Charts
Premium
Stock market trading graph showing financial data analysis
Economic Growth Chart Over Urban Cityscape with Digital Interface
Graph Icons Hologram with Social Media Notifications
Green Line Chart with Financial Data on Dark Background
Digital Stock Market Analysis with Graphs and Charts
Premium
Businessman analyzing financial graph showing growth and decline
Financial Market Data with Green Line Graph
Digital Financial Graph Illustrating Stock Market Trends
Dynamic Red Line Graph on Digital Black Grid Background
Green Bar and Line Graph on Dark Interface
Premium
A financial graph on a screen displays market data during a snowy winter evening in a blurred city
Soundwave Visualization and Data Analysis on Digital Grid
Fluctuating Finance Chart with Company Percentages and Abbreviations
Dynamic Financial Statistics with Cityscape Overlay
Green Line Graph Depicting Sustainability and Environmental Icons
Premium
A robotic hand in a business suit holds a holographic arrow showing a financial rebound from a red decline to a green upward trend, symbolizing market recovery.
Innovative Digital Finance Data Display on Dark Interface
Financial Data Analysis with Graphs and Charts on Dark Background
Financial Market Decline with Red Line Graph Overlay
Abstract Financial Graphs with Dynamic Green Trend Lines
Premium
Silver rocks and metal pieces in front of a financial chart
Futuristic 3D Data Visualization with Bar and Line Graphs
Futuristic Digital Dashboard with Neon Line Charts Analysis
Sustainability Finance Dashboard Displaying CO2 Emissions, Euro Trends and Growth Metrics
Digital Financial Data Analysis with Graphs
Futuristic Financial Graphs with Dynamic Green Line
Fluctuating Graph on Green Grid Background Illustrating Financial Trends
Premium
Abstract representation of the united kingdom flag overlaid with a fluctuating financial market graph showing economic trends and data analysis
Rising Green Market Graph Overlay in Dimly Lit Cityscape
Digital Stock Market Data Over Cityscape Concept
Dynamic Financial Graph Analyzing Market Trends
Financial Data Processing with Green Bar Graph Overlay
Premium
Hand interacting a glowing stock market graph on a digital screen, illustrating financial data investment trends
Financial Market Chart on Digital Screen Showing Growing Trends
Graph Showing Stock Market Activity and Financial Data Analysis
Dynamic Financial Graph with Green Bar and Line Increase
Abstract Financial Data Visualization with Graphs
Premium
A declining red stock market graph with a downward arrow symbolizes a financial crisis and economic recession.
Abstract Pink Bar Graph Over Digital Grid Background
Data Analytics with Dynamic Global Market Trends on Screen
Financial Data Graph Over Cityscape with Digital Overlay
Dynamic Stock Market Data and Cityscape Background
Premium
Magnifying Glass Examining Financial Chart with Market Candlesticks
Flag Overlay on Financial Data Illustrates Ukraine Crisis
Abstract Financial Graphs and Data Over Cityscape
Green Bar and Line Chart on Black Grid Representing Financial Data
Abstract Stock Market Graph with Digital Data Animation
Premium
Red Stock Market Chart Displaying a Sharp Decline, Indicating Financial Crisis and Investment Losses
Financial Stock Market Trends Over Digital Grid Background
Digital Analytics Visualization with Bar and Line Graphs
Stock Market Decline Data Analysis on Dark Grid Background
Dynamic Financial Data Growth Chart Display
Premium
Global Stock Market Financial Data Analysis Chart financial chart
Digital Dashboard Displaying Financial Chart and Analytics Interface
Market dashboard displaying candlestick chart, volume profile and moving averages
Digital Financial Data and Dynamic Stock Market Graphs
Dynamic Stock Market and Financial Data Analysis Concept
Circuitry and Data Stream on Digital Grid Background
Dynamic Financial Data Display with Declining Graph Visualization
Premium
Red downward trending stock market graph with candlestick chart showing financial decline and economic recession
Financial Data Visualization on Digital Grid
Dynamic Financial Data Charts on Dark Digital Background
Red Financial Trendline in Digital Interface Background
Green Bar Graph with Fluctuating Line Chart Depicting Financial Analysis
Premium
Minimalist white graph with red arrow pointing down. Business risk, financial decline and money loss
Abstract Financial Data with Digitally Enhanced Graphs
Dynamic Green Bar Graph with Rising Line in Digital Art Style
Statistical Data and Trends Over Digital Grid Overlay
Financial Data Overlay on Office Computers
Premium
Red stock market graph, financial data analytics, business loss
Digital Green Bar Graph Over Dark Background Illustrating Market Trends
Dynamic Red Graph Displaying Economic Fluctuations Over Cityscape
Abstract Financial Data Analysis and Stock Market Trends
Digital Financial Data Analytics on Modern Display
Premium
A bright jagged graph representing financial data descends dramatically through a stormy twilight sky
Futuristic Business Data Graphs over City Skyline
Global Financial Data Analysis on Grid Background
Financial Data Analysis with Dynamic Growth Charts
Colorful Financial Graphs on Digital Grid Background
Premium
Life's Ups and Downs
Dynamic Financial Data with Fluctuating Graph Lines
Green Line Graph Overlaid on Empty Office with Data Overlay
Abstract Financial Graphs with Red Trend Lines
Fluctuating Financial Data with Graph Overlay
Premium
Visual representation of the french economy with a national flag and a fluctuating financial market graph showing trends and data analysis
Subscriber Analytics Dashboard with Candlestick Charts and Line Graphs Showing 477,785 Subscribers