
- Home >
- Stock Photos >
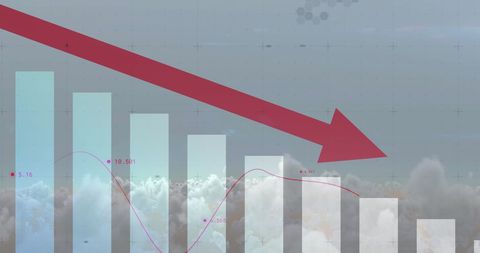
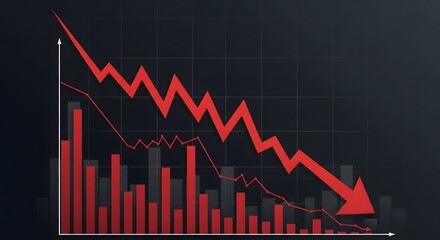
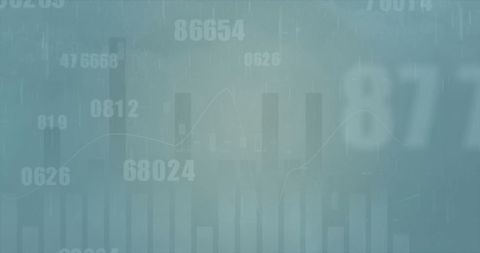
- Declining Graph with Data Bars and Circles Backdrop
Declining Graph with Data Bars and Circles Backdrop Image

Visual representation of a declining trend with graph and data bars over a blue backdrop featuring circular patterns. Perfect for illustrating economic downturns, financial analysis reports, or technology-oriented articles that focus on data processing challenges or business strategies involving declining metrics.
Powered by 


downloads
Tags:
More
Credit Photo
If you would like to credit the Photo, here are some ways you can do so
Text Link
photo Link
<span class="text-link">
<span>
<a target="_blank" href=https://pikwizard.com/photo/declining-graph-with-data-bars-and-circles-backdrop/c3ac0e9048c6530e75b7a0f719642895/>PikWizard</a>
</span>
</span>
<span class="image-link">
<span
style="margin: 0 0 20px 0; display: inline-block; vertical-align: middle; width: 100%;"
>
<a
target="_blank"
href="https://pikwizard.com/photo/declining-graph-with-data-bars-and-circles-backdrop/c3ac0e9048c6530e75b7a0f719642895/"
style="text-decoration: none; font-size: 10px; margin: 0;"
>
<img src="https://pikwizard.com/pw/medium/c3ac0e9048c6530e75b7a0f719642895.jpg" style="margin: 0; width: 100%;" alt="" />
<p style="font-size: 12px; margin: 0;">PikWizard</p>
</a>
</span>
</span>
Free (free of charge)
Free for personal and commercial use.
Author: Creative Art
Similar Free Stock Images

Premium


Premium


Premium


Premium


Premium


Premium

Premium

Premium

Premium


Premium


Premium


Premium


Premium


Premium

Premium

Premium

Premium


Premium


Premium


Premium


Premium

Premium


Premium


Premium


Premium


Explore More Free Stock Images