1. Home > 
  2. Stock Photos > 
  3. Declining Market Data on Digital Interface Overlaying Cityscape

Declining Market Data on Digital Interface Overlaying Cityscape Image

Declining Market Data on Digital Interface Overlaying Cityscape

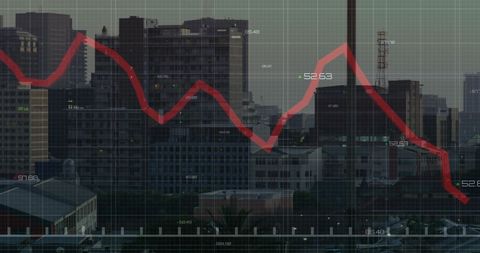
This visual combines digital data connected with stock market declines, superimposed on a cityscape background, forming a conceptual imagery of financial loss. Useful for illustrating economic articles, financial analysis, articles prescribing trend analysis, or illustrating integer problems in businesses or economies.

Powered by Shutterstock logo - Get 15% off with code: PIKWIZARD15
Financial graph with a red falling trend line overlay on a cityscape background, symbolizing a market downturn and financial crisis - Powered by Shutterstock - Get 15% off with code: PIKWIZARD15Skyscrapers with superimposed financial charts, symbolizing real estate market trends on a cloudy sky background, concept of market analysis - Powered by Shutterstock - Get 15% off with code: PIKWIZARD15A vibrant financial chart displays stock market data against a city skyline at dusk, emphasizing dynamic market fluctuations - Powered by Shutterstock - Get 15% off with code: PIKWIZARD15A businessman in despair with his hands on his head against a background with declining stock market graphs, highlighting financial crisis concept - Powered by Shutterstock - Get 15% off with code: PIKWIZARD15Futuristic Financial Market Trends 2025 Digital Stock Trading Analytics and Technology Concept with Growth - Powered by Shutterstock - Get 15% off with code: PIKWIZARD15

Credit Photo

If you would like to credit the Photo, here are some ways you can do so

Free (free of charge)

Free for personal and commercial use.

Author: Creative Art

Similar Free Stock Images

Loading...
Dynamic Stock Market Ticker Display with Financial Graphs
Premium
The digital stock market chart displayed a sign of a potential crash on the business information board
Financial Graph Data Overlay with Modern Cityscape Background
Futuristic Data Processing on Global Map Background
Abstract Representation of Stock Market Data Overlaying Urban Landscape
Advanced Financial Data and Stock Market Analysis Background
Financial Statistics Overlay Office Cadence
Premium
A businessman is looking at a graph on a monitor. An exchange broker evaluates stock market trends. A man with glasses in front of a curve of the dynamics of economy.
Premium
Financial graphs over a city skyline representing real estate market trends, with a digital and analytical concept on a twilight background
Premium
Stock crash market exchange loss trading graph analysis investment indicator business graph charts of financial digital background down stock crisis red price in down trend chart fall
Financial Data Visualization with Team Collaboration in Modern Office
Financial Market Decline Over Networked Cityscape
Digital Stock Market Data Against Skyscraper Background
Global Data Analytics and Network Visualization on Digital Grid
Analyzing Statistical Data Over Digital Network With Cityscape
Financial Chart with Falling Trends in Corporate Environment
Red up and down financial graph on grey digital background
Dynamic Digital Interface Displaying Financial Data Analysis
Digital Interface Displaying Data Processing and Statistics
Premium
Businessman hand using falling stock chart on screen interface with index. Trade and finance concept. Double exposure
Cybercrime and Data Breach Concept with Digital Padlock
Binary Code and Financial Graphs Overlaying Urban Skyline
Cybersecurity Technology with Digital Data Interface Design
Digitally Generated Financial Graphs Overlaid on Cityscape
Dynamic Finance Double Exposure with Graphs and Data Interfaces
Digital Workspace with Interactive Analytics Dashboard
Futuristic Cybersecurity Encryption Interface with Data and Network Diagrams
Financial Data Visualization with Gridlines and Trends
Green Line Fluctuating on Digital Stock Market Interface with Red Bars
Global Business Analytics with Graph and Map Elements
Cyber Dashboard Displaying IP Tables with Neon Charts, Rising Bars and Red Arrow
Dynamic Financial Data and Stock Market Interface
Dynamic Financial Data and Graph Arrows in Digital Interface
Digital Financial Graphs Overlayed on City Background at Night
Financial Decline on Digital Warehouse Background
Data Processing Over World Map Illustrating Global Technology
Digital Stock Market Dashboard Over Cityscape
Premium
An investor monitors real-time stock market data on a smartphone and laptop, analyzing charts, financial trends, and cryptocurrency for informed trading decisions in a digital workspace.
Digital Data Processing with Code Display Visualization
City Skyline with Digital Data Overlay Depicting Financial Growth
Dynamic Financial Graphs with Futuristic Cityscape Backdrop
Decreasing Trend Graph Over Urban Cityscape at Dusk
Data Processing and Loading in Digital Server Environment
Digital Stock Data Over City Landscape Illustrating Global Economy
Financial Data Visualization with Growing Business Charts
Futuristic Interface with Complex Data and Code
Financial Charts Overlaid with Data and Trends in Abstract Display
Premium
AI visualizes economic caution with smart graphs, alert icons, and data trend analysis, helping businesses respond to financial instability and risk. Artificial intelligence spline
Premium
A hand poised over a touchscreen device displaying stock market data and colorful graphs. The image illustrates the integration of technology in financial analysis.
Abstract Landscape with Financial Data and Global Connections
Financial Data Processing with Digital Interface Display
Digital Interface Displaying Data Processing Analytics on Black Background
Premium
Businessman analyzing financial charts with falling graphs on a dark background, representing a stock market crisis concept
Financial Data Analysis with Diverse Team and Digital Growth Charts
Financial Graphs and Data on Digital Screen Background
Digital Financial Data Overlay Virtual Financial Interface
Digital Data Analysis Overlay on Cityscape for Business Insights
Cybersecurity Interface with System Log Data and Monitoring Glitches
Futuristic Digital Landscape with Data Visualization and Code
Aerial View of Farmland with Financial Market Data Overlay
Premium
An investor monitors real-time stock market data on a smartphone and laptop, analyzing charts, financial trends, and cryptocurrency for informed trading decisions in a digital workspace.
Premium
An investor monitors real-time stock market data on a smartphone and laptop, analyzing charts, financial trends, and cryptocurrency for informed trading decisions in a digital workspace.
Maroon Data Dashboard Showing Declining Red Area Chart With Pie Charts and Candlestick Trends
Data Terminal with Moving Graph Lines over Skyscrapers
Digital Globe Overlay with Financial Data Streams
Premium
Economic caution visual showing risk alerts and financial volatility. Warning signs highlight economic downturn, market risk, finance crisis, and uncertainty in data-driven analysis. Muxer
Premium
A blurred silhouette of a person is seen in the foreground with a background of a stock market chart displaying a fluctuating trend line in red and green.
Premium
Oil pumpjack with financial stock market graphs, red declining charts, and economic data overlay on dark background. Concept of oil market decline
Digital Data Processing Overlay on Urban Cityscape
Financial Data and Global Business People in Office Reflecting Virtual Analytics
Digital Data Visualization with Dynamic Graph and Global Interface
Futuristic HUD Interface for Data Analysis and Finance
Stock Market Graphs Overlay on City Skyline Backdrop
Financial Data Signals Overlaid on Online Data Security Center
Financial Data Analytic Visualization Over Cityscape Background
Digital Stock Market Display Over Cityscape
Premium
Close-up of a hand using a magnifying glass to examine stock market candlestick charts. Visualizes financial analysis, trading strategies, and investment decision-making.
Premium
City skyline with financial chart overlay showing downward trends, sunset backdrop, double exposure style, concept of market crash and business loss
Analyzing Financial Data with Digital Graphs on Transparent Screens
Digital Stock Market Data on Red Background
Dynamic Financial Market Graph with Data Points
Premium
Red falling arrow and declining chart with stock market data overlay on office interior background, symbolizing global financial collapse impact
Data Analytics in Rugby with Graphic Interface Overlay
Digital Security with Global Connections and Data
Financial Graphs Overlaid on Text Symbolizing Data Analysis
Data Processing Concept with Digital Interface and Code Overlay
Premium
The digital indicators and declining graphs of a stock market crash overlap the backdrop of a modernistic city. Concept of a market crash in double exposure.
Premium
An investor monitors real-time stock market data on a smartphone and laptop, analyzing charts, financial trends, and cryptocurrency for informed trading decisions in a digital workspace.
Premium
An investor monitors real-time stock market data on a smartphone and laptop, analyzing charts, financial trends, and cryptocurrency for informed trading decisions in a digital workspace.
Dynamic Digital Dashboard with Analytical Data Insights
Programming Interface with Code and Graph Analytics on Monitor
Global Data Network Visualization with Timeline
Global Network and Data Visualization on High-Tech Interface
Premium
An investor monitors real-time stock market data on a smartphone and laptop, analyzing charts, financial trends, and cryptocurrency for informed trading decisions in a digital workspace.
Financial Data Analyzing with Urban Office Background
Futuristic Data Analysis with Digital Charts and Code
Digital Data Visualization Over Urban Skyline Concept
Dynamic Stock Market Data on Digital Display Background
Caucasian Female Engineer Analyzing Code in Server Room
Financial Data Processing Overlaying City Skyline
Digital Data and Stock Analysis over Urban Skyscraper Background
Stock Market Data Overlaid on Cityscape Reflects Fluctuating Global Economy
Digital Finance Analytics Interface with Transparent Cityscape Background
Futuristic Infographic Commissioning Data Analysis with Graphics
Cybersecurity Interface: Data Processing with Digital Shield Icon
Premium
An investor monitors real-time stock market data on a smartphone and laptop, analyzing charts, financial trends, and cryptocurrency for informed trading decisions in a digital workspace.
Premium
Bright financial displays show real-time stock market data with red, green, and purple charts, representing volatility and trading analysis.
Financial Data Visualization with Red Downtrend Line in Virtual Environment
Financial Data and Cityscape for Global Business Analysis
Animated Stock Market Data Over Cityscape
Abstract Digital Financial Data with Moving Light Trails
Digital File Transfer and Data Processing Concept
Digital Data Processing Overlay with Graphs and Charts
Digital Data Visualization Overlaying Sports Stadium
Stressed Female Doctor with Falling Graph in Background Illustrating Challenges
Digital Financial Data Processing Interface with Graphs and Codes
Premium
A blurred silhouette of a person is seen in the foreground with a background of a stock market chart displaying a fluctuating trend line in red and green.
Data Security Codes Amid Digital Circuit Lines
Financial Data Overlaying Cityscape Illustrating Global Market Trends
Innovative Team Analyzing Global Data on Digital Display in Meeting Room
Futuristic Holographic Data Terminal Spanning Industrial Space
Premium
An investor monitors real-time stock market data on a smartphone and laptop, analyzing charts, financial trends, and cryptocurrency for informed trading decisions in a digital workspace.
Analytics Dashboard with Trend Lines and Code Snippets
Mysterious Programmer Analyzing Data on Multiple Screens
Displaying code editor overlaying bar charts and line graphs for data analytics dashboard