- Home >
- Stock Photos >
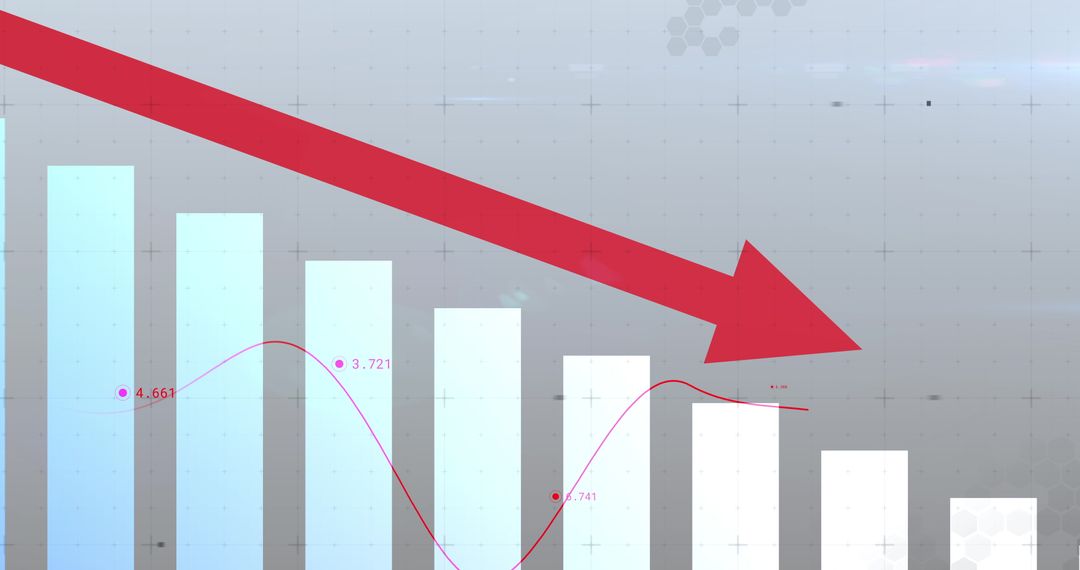
- Declining Market Visualization with Magenta Arrow Crossing Blue Bar Chart and Line Markers
Declining Market Visualization with Magenta Arrow Crossing Blue Bar Chart and Line Markers Image

Visualization presenting bold magenta downward arrow crossing tall blue-to-cyan bars with thin magenta trendline and circular data markers on dark grid backdrop. Hexagon accents and subtle glow adding modern tech aesthetic while gradient colors creating strong visual contrast to emphasize falling values. Ideal for corporate presentations highlighting revenue decline, investor reports illustrating stock downturn, editorial pieces on market volatility, blog headers about economic analysis, and social media posts announcing quarterly results. Graphic working well in slide decks, financial dashboards, websites, newsletters, and infographics. Suggest customizing by overlaying percentage figures, timeframe labels, company logo, or call-to-action banners; color adjustments and vector export enabling resizing for print or digital campaigns.
Powered by  - Get 15% off with code: PIKWIZARD15


0
downloads
downloads
Tags:
More
Credit Photo
If you would like to credit the Photo, here are some ways you can do so
Text Link
photo Link
<span class="text-link">
<span>
<a target="_blank" href=https://pikwizard.com/photo/declining-market-visualization-with-magenta-arrow-crossing-blue-bar-chart-and-line-markers/b6333bb20b56cd98aee78dd157c1f294/>PikWizard</a>
</span>
</span>
<span class="image-link">
<span
style="margin: 0 0 20px 0; display: inline-block; vertical-align: middle; width: 100%;"
>
<a
target="_blank"
href="https://pikwizard.com/photo/declining-market-visualization-with-magenta-arrow-crossing-blue-bar-chart-and-line-markers/b6333bb20b56cd98aee78dd157c1f294/"
style="text-decoration: none; font-size: 10px; margin: 0;"
>
<img src="https://pikwizard.com/pw/medium/b6333bb20b56cd98aee78dd157c1f294.jpg" style="margin: 0; width: 100%;" alt="" />
<p style="font-size: 12px; margin: 0;">PikWizard</p>
</a>
</span>
</span>
Free (free of charge)
Free for personal and commercial use.
Author: Authentic Images
Similar Free Stock Images

Premium


Premium


Premium


Premium


Premium


Premium


Premium


Premium


Premium


Premium


Premium