- Home >
- Stock Photos >
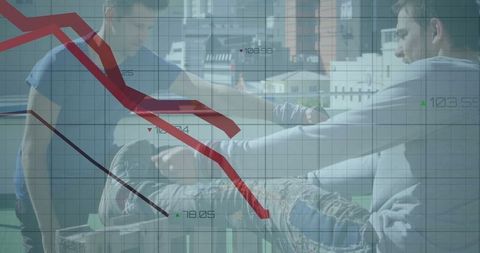
- Declining Red Graph in Data Processing Conceptual Interface
Declining Red Graph in Data Processing Conceptual Interface Image

Imagery showcasing red line graph amidst network of data-filled futuristic screens, signifying business decline or market analysis. Ideal for use in discussions on market trends, research, data science, financial forecasts, or illustrating digital transformation themes in presentations.

downloads
Tags:
More
Credit Photo
If you would like to credit the Photo, here are some ways you can do so
Text Link
photo Link
<span class="text-link">
<span>
<a target="_blank" href=https://pikwizard.com/photo/declining-red-graph-in-data-processing-conceptual-interface/20fea650741780050f1f319451fd889d/>PikWizard</a>
</span>
</span>
<span class="image-link">
<span
style="margin: 0 0 20px 0; display: inline-block; vertical-align: middle; width: 100%;"
>
<a
target="_blank"
href="https://pikwizard.com/photo/declining-red-graph-in-data-processing-conceptual-interface/20fea650741780050f1f319451fd889d/"
style="text-decoration: none; font-size: 10px; margin: 0;"
>
<img src="https://pikwizard.com/pw/medium/20fea650741780050f1f319451fd889d.jpg" style="margin: 0; width: 100%;" alt="" />
<p style="font-size: 12px; margin: 0;">PikWizard</p>
</a>
</span>
</span>
Free (free of charge)
Free for personal and commercial use.
Author: Awesome Content