- Home >
- Stock Photos >
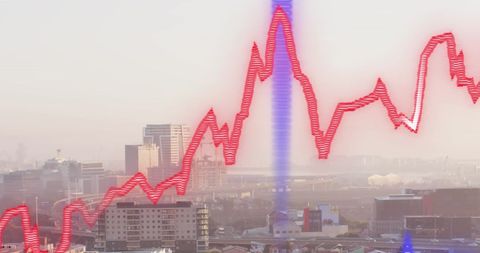
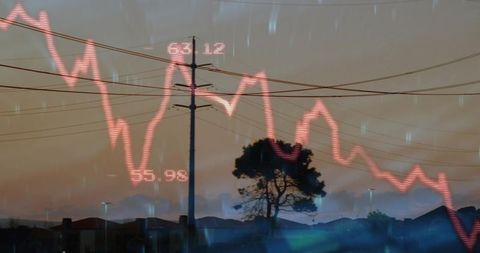
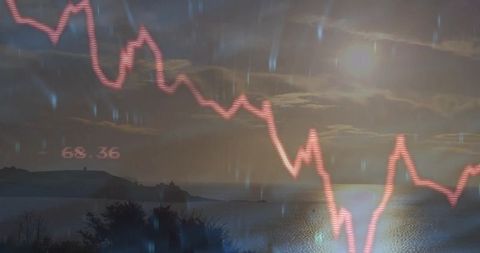
- Declining Stock Market Chart Overlap with Night Cityscape
Declining Stock Market Chart Overlap with Night Cityscape Image

A graphical representation of a declining stock market is overlaid on a city nightscape, illustrating the volatility and downturn of financial markets. The combination of red line graphs against a blurred urban background provides a symbolic view of financial stress and economic problems. Ideal for use on articles or presentations about market trends, economic crises, or financial analytics.
Powered by 


0
downloads
downloads
Tags:
More
Credit Photo
If you would like to credit the Photo, here are some ways you can do so
Text Link
photo Link
<span class="text-link">
<span>
<a target="_blank" href=https://pikwizard.com/photo/declining-stock-market-chart-overlap-with-night-cityscape/9de0421f7fa3c097713121addd5881f1/>PikWizard</a>
</span>
</span>
<span class="image-link">
<span
style="margin: 0 0 20px 0; display: inline-block; vertical-align: middle; width: 100%;"
>
<a
target="_blank"
href="https://pikwizard.com/photo/declining-stock-market-chart-overlap-with-night-cityscape/9de0421f7fa3c097713121addd5881f1/"
style="text-decoration: none; font-size: 10px; margin: 0;"
>
<img src="https://pikwizard.com/pw/medium/9de0421f7fa3c097713121addd5881f1.jpg" style="margin: 0; width: 100%;" alt="" />
<p style="font-size: 12px; margin: 0;">PikWizard</p>
</a>
</span>
</span>
Free (free of charge)
Free for personal and commercial use.
Author: Awesome Content
Similar Free Stock Images
Loading...

Premium


Premium

Premium


Premium


Premium


Premium

Premium


Premium


Premium


Premium


Premium

Premium


Premium


Premium


Premium


Premium


Premium


Premium


Premium


Premium


Premium


Premium


Premium


Premium


Premium