
- Home >
- Stock Photos >
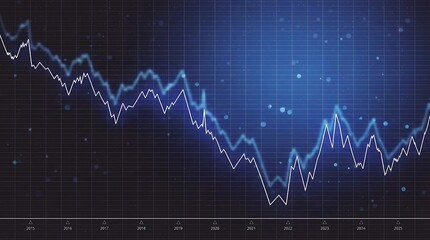
- Declining Stock Market Graph with Interactive Elements
Declining Stock Market Graph with Interactive Elements Image

Visual representation of a red line graph navigating downwards across a dark grid-structured financial dashboard. Speech bubbles with numbers presumably indicating activity or opinions, including a subtle lens flare and other interactive elements interspersed. Utilized for content related to financial crises, market analysis, economic trends, or educational demonstrations of data dashboard interfaces.
Powered by 


downloads
Tags:
More
Credit Photo
If you would like to credit the Photo, here are some ways you can do so
Text Link
photo Link
<span class="text-link">
<span>
<a target="_blank" href=https://pikwizard.com/photo/declining-stock-market-graph-with-interactive-elements/8aee139c886304959df257694f5c9c08/>PikWizard</a>
</span>
</span>
<span class="image-link">
<span
style="margin: 0 0 20px 0; display: inline-block; vertical-align: middle; width: 100%;"
>
<a
target="_blank"
href="https://pikwizard.com/photo/declining-stock-market-graph-with-interactive-elements/8aee139c886304959df257694f5c9c08/"
style="text-decoration: none; font-size: 10px; margin: 0;"
>
<img src="https://pikwizard.com/pw/medium/8aee139c886304959df257694f5c9c08.jpg" style="margin: 0; width: 100%;" alt="" />
<p style="font-size: 12px; margin: 0;">PikWizard</p>
</a>
</span>
</span>
Free (free of charge)
Free for personal and commercial use.
Author: Awesome Content
Similar Free Stock Images

Premium


Premium

Premium


Premium


Premium


Premium


Premium


Premium


Premium

Premium


Premium


Premium


Premium
Premium

Premium


Premium


Premium


Premium


Premium


Premium


Premium


Premium


Premium


Premium


Premium
Explore More Free Stock Images