- Home >
- Stock Photos >
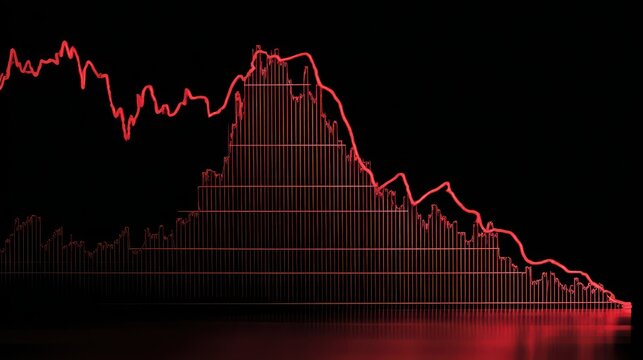
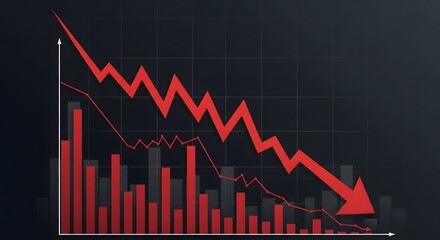
- Declining Stock Market Trends with Digital World Map
Declining Stock Market Trends with Digital World Map Image

Illustrates declining trends in financial markets, using bold red lines and digital numerical data overlay. World map integrated digitally to highlight global impact, showcasing financial, economic analysis and business use. Ideal for articles on financial crises, economic downturn forecasts, and global financial reports.
Powered by 


2
downloads
downloads
Tags:
More
Credit Photo
If you would like to credit the Photo, here are some ways you can do so
Text Link
photo Link
<span class="text-link">
<span>
<a target="_blank" href=https://pikwizard.com/photo/declining-stock-market-trends-with-digital-world-map/27e218e897e74ab930d8505969c326b7/>PikWizard</a>
</span>
</span>
<span class="image-link">
<span
style="margin: 0 0 20px 0; display: inline-block; vertical-align: middle; width: 100%;"
>
<a
target="_blank"
href="https://pikwizard.com/photo/declining-stock-market-trends-with-digital-world-map/27e218e897e74ab930d8505969c326b7/"
style="text-decoration: none; font-size: 10px; margin: 0;"
>
<img src="https://pikwizard.com/pw/medium/27e218e897e74ab930d8505969c326b7.jpg" style="margin: 0; width: 100%;" alt="" />
<p style="font-size: 12px; margin: 0;">PikWizard</p>
</a>
</span>
</span>
Free (free of charge)
Free for personal and commercial use.
Author: Creative Art
Similar Free Stock Images
Loading...

Premium


Premium


Premium


Premium


Premium


Premium


Premium


Premium


Premium


Premium


Premium


Premium

Premium

Premium


Premium


Premium


Premium

Premium


Premium


Premium


Premium

Premium


Premium


Premium


Premium