- Home >
- Stock Photos >
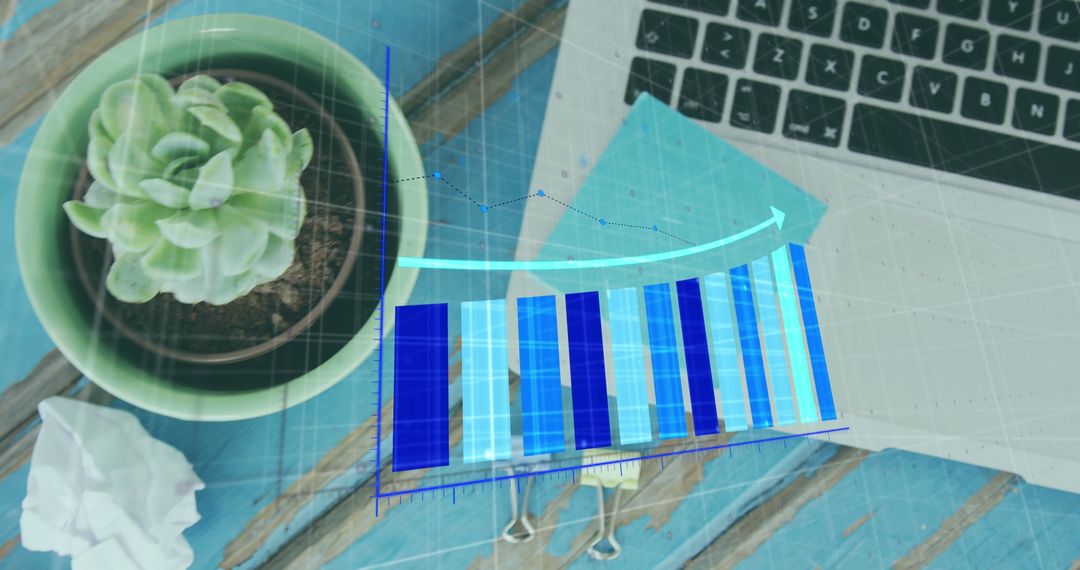
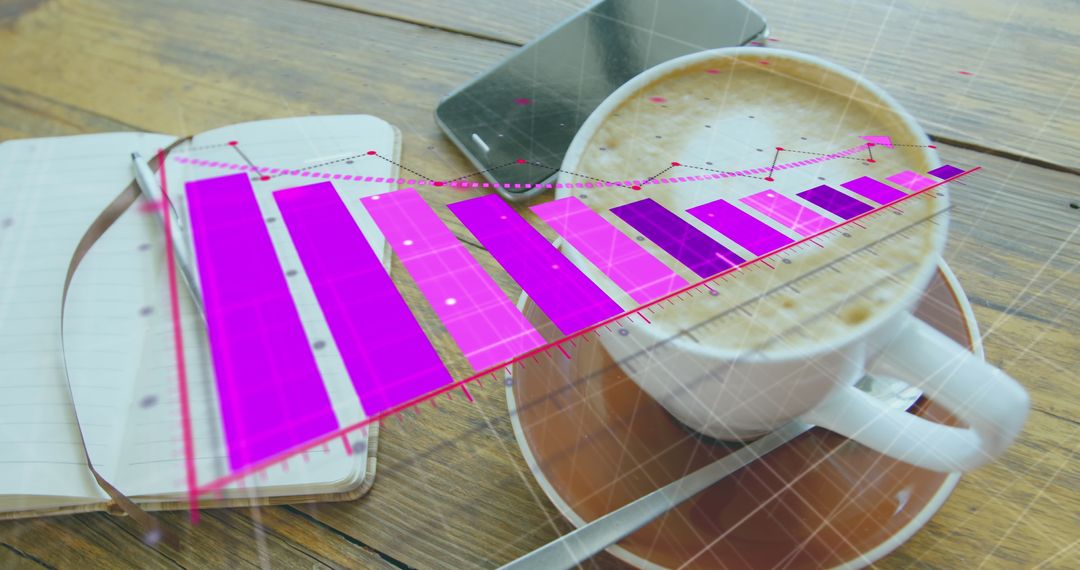
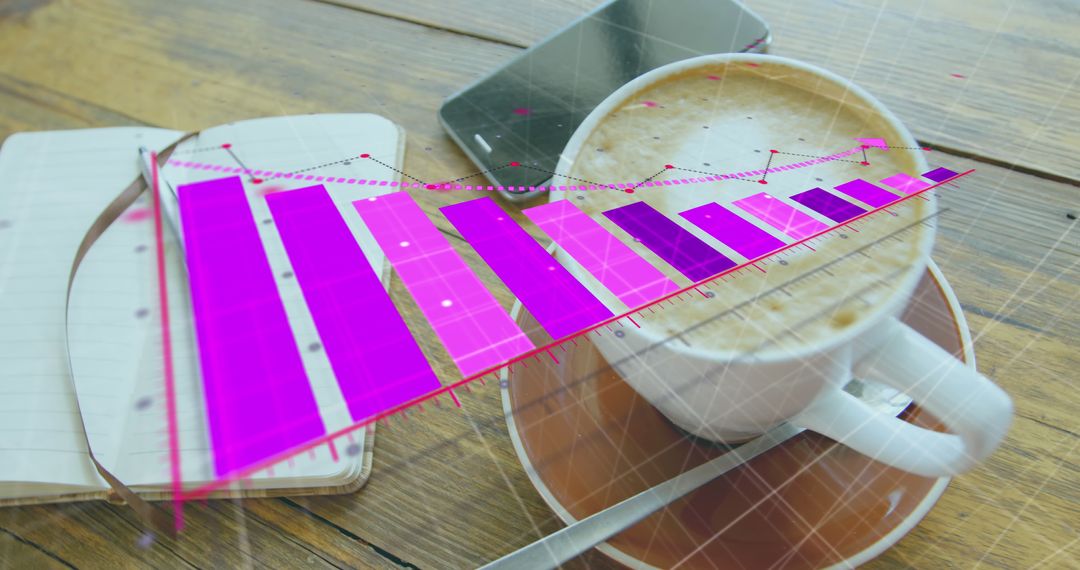
- Decreasing Bar Graph and Notebook with Coffee Mug on Wood Table
Decreasing Bar Graph and Notebook with Coffee Mug on Wood Table Image
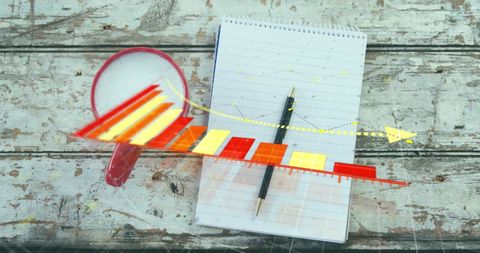
This image combines elements of business analysis and casual work environments, showing a bar graph trending downward with an overlay, symbolizing financial losses or reduction. The presence of a notebook, pen, and a mug of coffee on a rustic wood table suggests a work-from-home or informal business setup. It could be used for articles or presentations on economic trends, reports on business performance, or home office stock photos aiming to blend personal comfort with professional pursuits.
Powered by 


2
downloads
downloads
Tags:
More
Credit Photo
If you would like to credit the Photo, here are some ways you can do so
Text Link
photo Link
<span class="text-link">
<span>
<a target="_blank" href=https://pikwizard.com/photo/decreasing-bar-graph-and-notebook-with-coffee-mug-on-wood-table/d2d94924867cb8631a002db96e6d0258/>PikWizard</a>
</span>
</span>
<span class="image-link">
<span
style="margin: 0 0 20px 0; display: inline-block; vertical-align: middle; width: 100%;"
>
<a
target="_blank"
href="https://pikwizard.com/photo/decreasing-bar-graph-and-notebook-with-coffee-mug-on-wood-table/d2d94924867cb8631a002db96e6d0258/"
style="text-decoration: none; font-size: 10px; margin: 0;"
>
<img src="https://pikwizard.com/pw/medium/d2d94924867cb8631a002db96e6d0258.jpg" style="margin: 0; width: 100%;" alt="" />
<p style="font-size: 12px; margin: 0;">PikWizard</p>
</a>
</span>
</span>
Free (free of charge)
Free for personal and commercial use.
Author: Awesome Content
Similar Free Stock Images

Premium


Premium


Premium


Premium


Premium


Premium


Premium


Premium


Premium