- Home >
- Stock Photos >
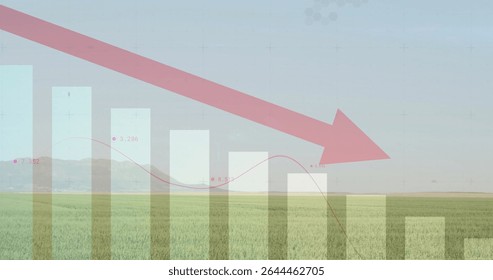
- Decreasing Blue Data Bars with Red Downward Arrow and Numbers
Decreasing Blue Data Bars with Red Downward Arrow and Numbers Image

Blue bars are charted with a red arrow pointing downward indicating a decline within a digital interface. With interwoven numbers and additional marker lines, the visualization suggests changes over time audited through metrics and statistics. Useful for illustrating market trends, explaining financial analytics, or presenting complicated data to communicate insightful information visually.
Powered by  - Get 15% off with code: PIKWIZARD15


2
downloads
downloads
Tags:
More
Credit Photo
If you would like to credit the Photo, here are some ways you can do so
Text Link
photo Link
<span class="text-link">
<span>
<a target="_blank" href=https://pikwizard.com/photo/decreasing-blue-data-bars-with-red-downward-arrow-and-numbers/de30ba147058597dc06cf0f726d71c11/>PikWizard</a>
</span>
</span>
<span class="image-link">
<span
style="margin: 0 0 20px 0; display: inline-block; vertical-align: middle; width: 100%;"
>
<a
target="_blank"
href="https://pikwizard.com/photo/decreasing-blue-data-bars-with-red-downward-arrow-and-numbers/de30ba147058597dc06cf0f726d71c11/"
style="text-decoration: none; font-size: 10px; margin: 0;"
>
<img src="https://pikwizard.com/pw/medium/de30ba147058597dc06cf0f726d71c11.jpg" style="margin: 0; width: 100%;" alt="" />
<p style="font-size: 12px; margin: 0;">PikWizard</p>
</a>
</span>
</span>
Free (free of charge)
Free for personal and commercial use.
Author: Authentic Images
Similar Free Stock Images

Premium


Premium


Premium


Premium


Premium


Premium


Premium


Premium


Premium


Premium


Premium


Premium


Premium


Premium


Premium


Premium


Premium


Premium


Premium


Premium


Premium


Premium


Premium


Premium