
- Home >
- Stock Photos >
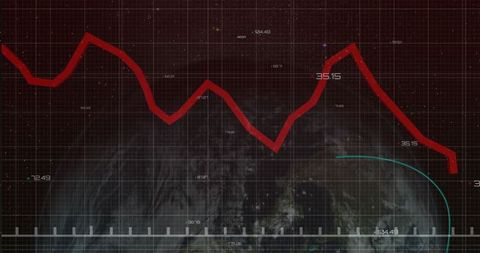
- Descending Financial Graph on Global Grid Background
Descending Financial Graph on Global Grid Background Image

This graphic of a red line graph indicates a financial downturn, displayed on a grid with global map silhouettes, serving as a symbol of declining market trends. Use this for presentations on economic conditions, financial analytics, or market studies to visually communicate trends and data fluctuations.
Powered by  - Get 15% off with code: PIKWIZARD15


downloads
Tags:
More
Credit Photo
If you would like to credit the Photo, here are some ways you can do so
Text Link
photo Link
<span class="text-link">
<span>
<a target="_blank" href=https://pikwizard.com/photo/descending-financial-graph-on-global-grid-background/bbd6db78a4d2dad0a7b1a6bcdc8e57b1/>PikWizard</a>
</span>
</span>
<span class="image-link">
<span
style="margin: 0 0 20px 0; display: inline-block; vertical-align: middle; width: 100%;"
>
<a
target="_blank"
href="https://pikwizard.com/photo/descending-financial-graph-on-global-grid-background/bbd6db78a4d2dad0a7b1a6bcdc8e57b1/"
style="text-decoration: none; font-size: 10px; margin: 0;"
>
<img src="https://pikwizard.com/pw/medium/bbd6db78a4d2dad0a7b1a6bcdc8e57b1.jpg" style="margin: 0; width: 100%;" alt="" />
<p style="font-size: 12px; margin: 0;">PikWizard</p>
</a>
</span>
</span>
Free (free of charge)
Free for personal and commercial use.
Author: Creative Art
Similar Free Stock Images

Premium

Premium


Premium


Premium


Premium


Premium


Premium

Premium


Premium


Premium


Premium


Premium


Premium


Premium


Premium


Premium


Premium

Premium

Premium


Premium

Premium

Premium


Premium


Premium


Premium


Explore More Free Stock Images