
- Home >
- Stock Photos >
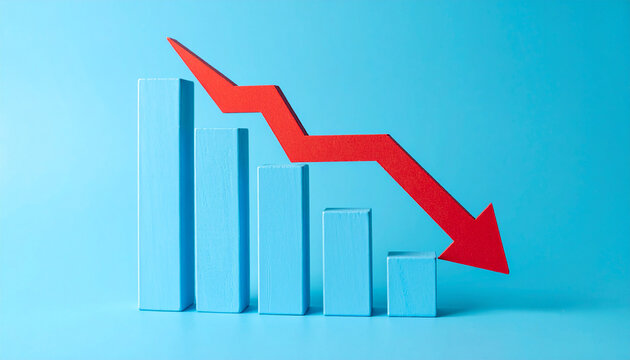
- Descending Trend Graph on Pink Gradient Background
Descending Trend Graph on Pink Gradient Background Image

Abstract illustration of a declining trend on a pink gradient background with grid design, showcasing statistical and financial data analysis. Useful for presentations on economic downturns, market analysis, and business forecasts.
Powered by 


downloads
Tags:
More
Credit Photo
If you would like to credit the Photo, here are some ways you can do so
Text Link
photo Link
<span class="text-link">
<span>
<a target="_blank" href=https://pikwizard.com/photo/descending-trend-graph-on-pink-gradient-background/8b121fe83b5c19e07d4d6c73fb4422f2/>PikWizard</a>
</span>
</span>
<span class="image-link">
<span
style="margin: 0 0 20px 0; display: inline-block; vertical-align: middle; width: 100%;"
>
<a
target="_blank"
href="https://pikwizard.com/photo/descending-trend-graph-on-pink-gradient-background/8b121fe83b5c19e07d4d6c73fb4422f2/"
style="text-decoration: none; font-size: 10px; margin: 0;"
>
<img src="https://pikwizard.com/pw/medium/8b121fe83b5c19e07d4d6c73fb4422f2.jpg" style="margin: 0; width: 100%;" alt="" />
<p style="font-size: 12px; margin: 0;">PikWizard</p>
</a>
</span>
</span>
Free (free of charge)
Free for personal and commercial use.
Author: Awesome Content
Similar Free Stock Images

Premium


Premium


Premium


Premium

Premium


Premium

Premium

Premium

Premium


Premium


Premium


Premium


Premium


Premium

Premium
Premium


Premium


Premium


Premium


Premium


Premium


Premium


Premium

Premium


Premium

Explore More Free Stock Images