- Home >
- Stock Photos >
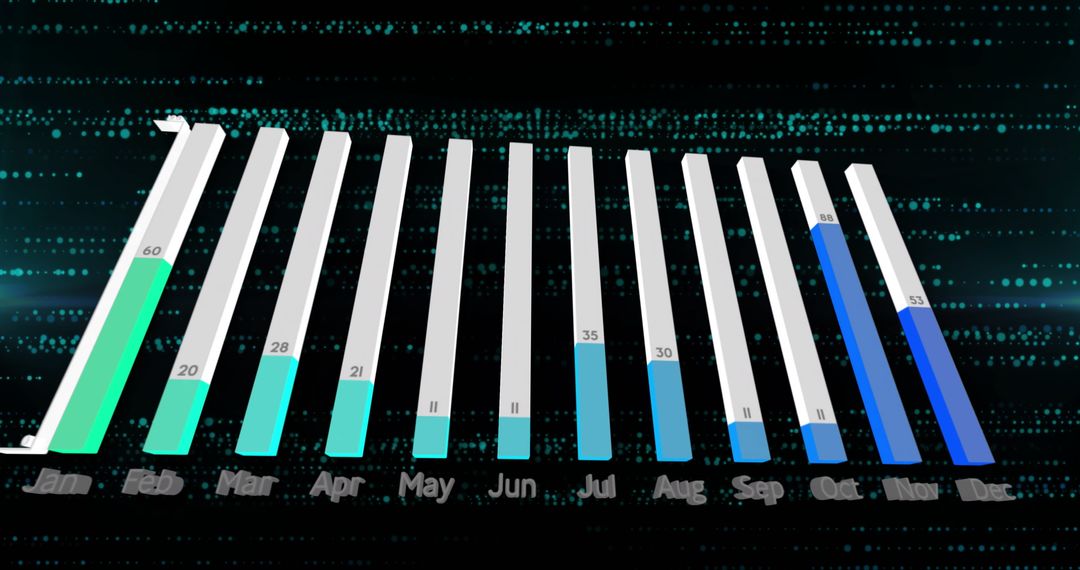
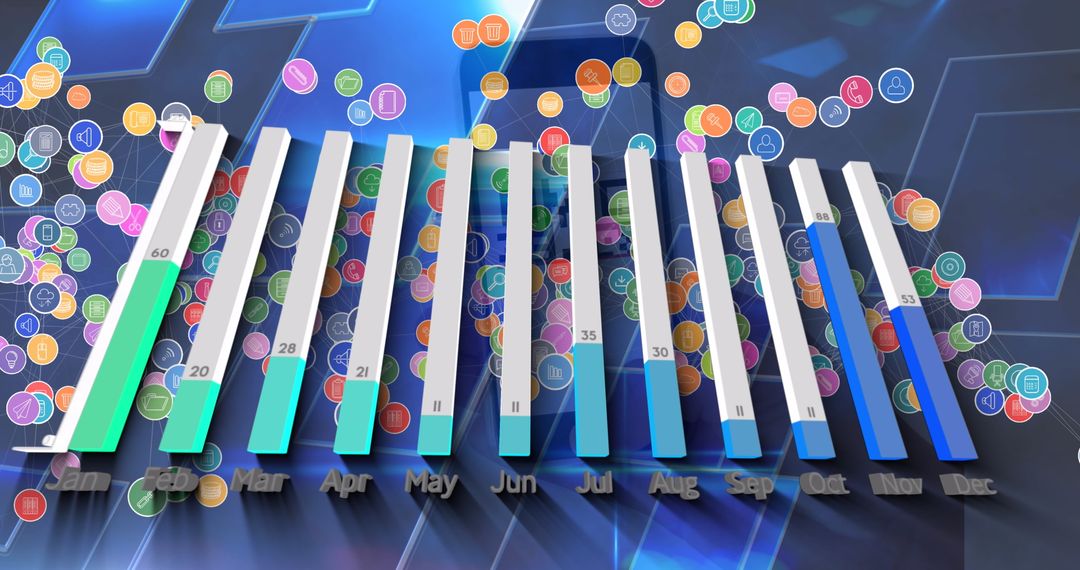
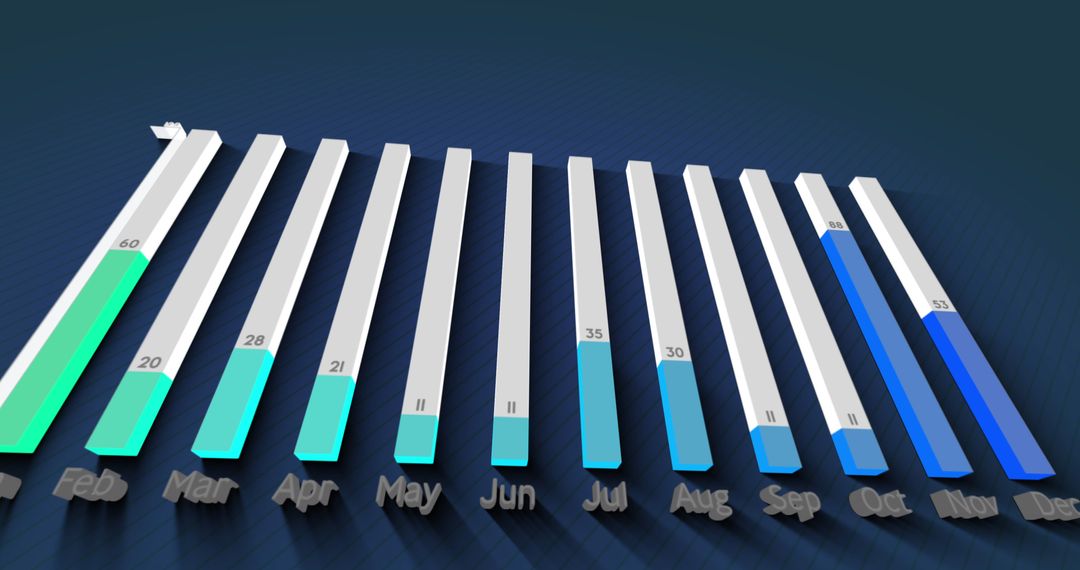
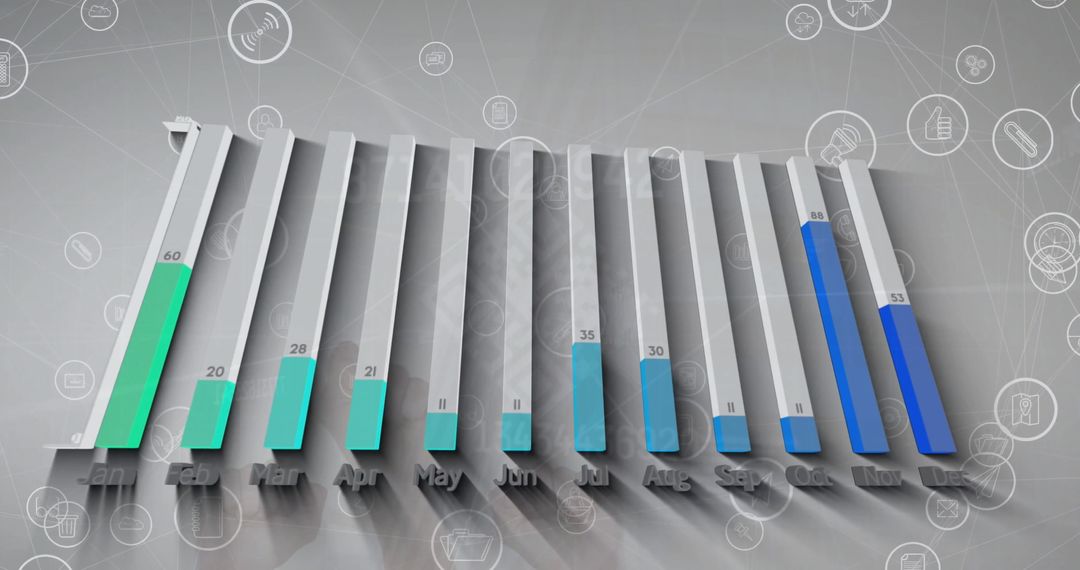
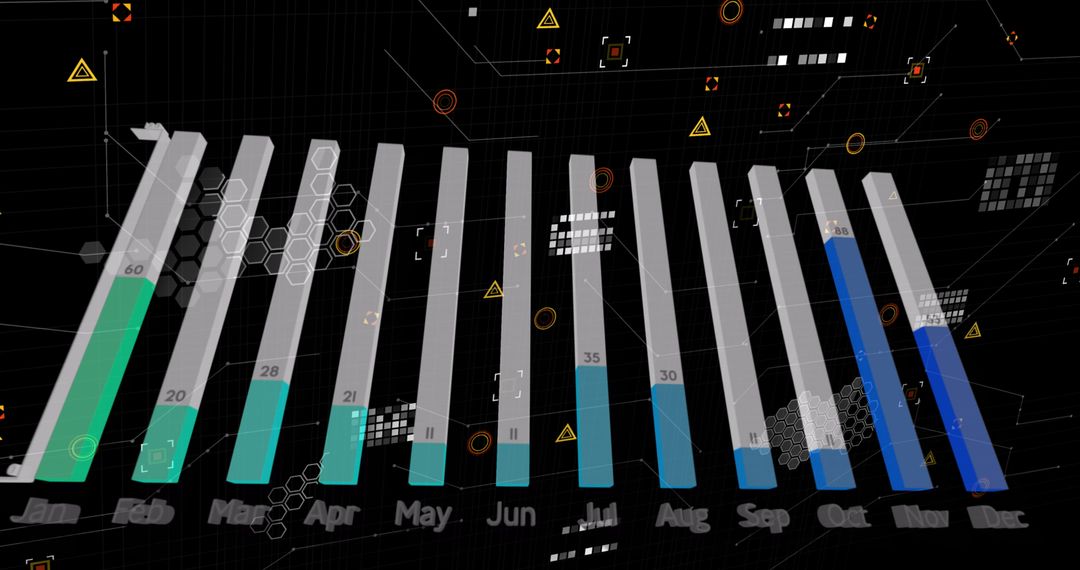
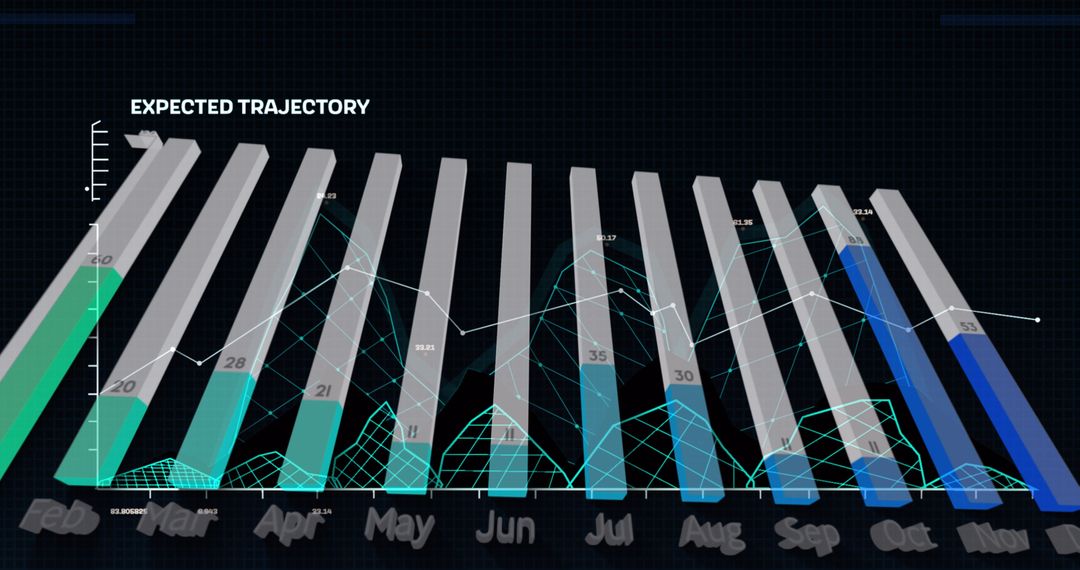
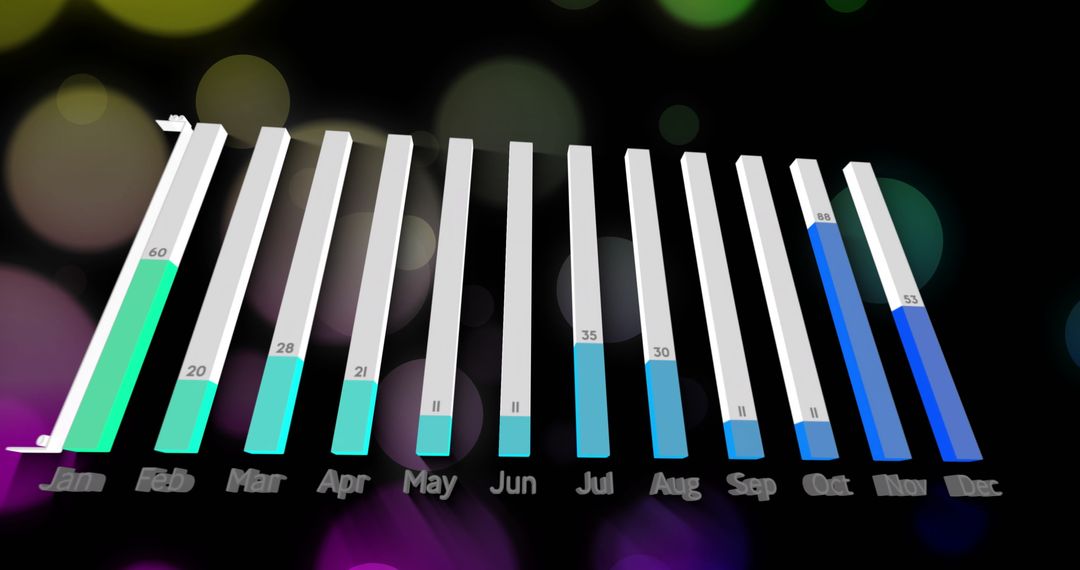
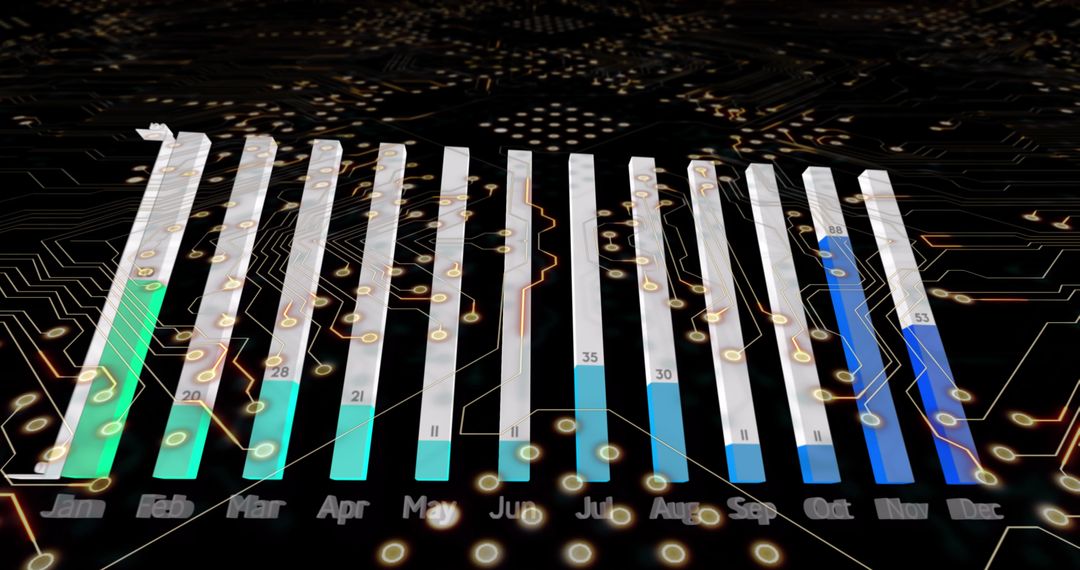
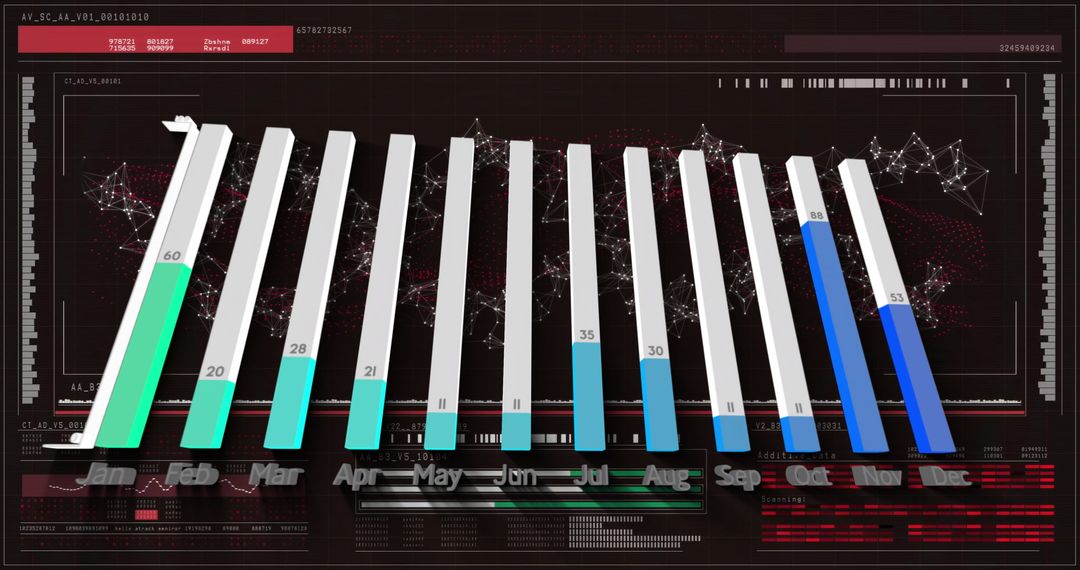
- Digital 3D Bar Graph Overlays Circuit Board Background
Digital 3D Bar Graph Overlays Circuit Board Background Image

This depiction showcases a dynamic 3D bar graph set against a detailed circuit board background, symbolizing modern data processing and technology. It highlights monthly statistics, making it a fitting visual for presentations, reports, or articles about data analytics, technological advancements, or business analysis.
Powered by  - Get 15% off with code: PIKWIZARD15


2
downloads
downloads
Tags:
More
Credit Photo
If you would like to credit the Photo, here are some ways you can do so
Text Link
photo Link
<span class="text-link">
<span>
<a target="_blank" href=https://pikwizard.com/photo/digital-3d-bar-graph-overlays-circuit-board-background/d6adf30f9895ecad62b6cb532ba650b7/>PikWizard</a>
</span>
</span>
<span class="image-link">
<span
style="margin: 0 0 20px 0; display: inline-block; vertical-align: middle; width: 100%;"
>
<a
target="_blank"
href="https://pikwizard.com/photo/digital-3d-bar-graph-overlays-circuit-board-background/d6adf30f9895ecad62b6cb532ba650b7/"
style="text-decoration: none; font-size: 10px; margin: 0;"
>
<img src="https://pikwizard.com/pw/medium/d6adf30f9895ecad62b6cb532ba650b7.jpg" style="margin: 0; width: 100%;" alt="" />
<p style="font-size: 12px; margin: 0;">PikWizard</p>
</a>
</span>
</span>
Free (free of charge)
Free for personal and commercial use.
Author: Authentic Images
Similar Free Stock Images

Premium


Premium


Premium


Premium


Premium


Premium


Premium


Premium


Premium


Premium


Premium


Premium


Premium


Premium


Premium


Premium


Premium


Premium


Premium


Premium


Premium


Premium


Premium


Premium