
- Home >
- Stock Photos >
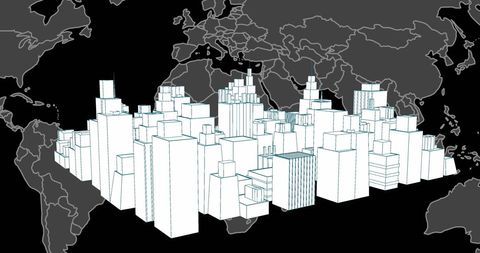
- Digital 3D Blueprint City with Dynamic Graph Statistics
Digital 3D Blueprint City with Dynamic Graph Statistics Image

Depicting a virtual 3D model of a city, this visualization overlays dynamic statistical graphs and analytics. Ideal for presentations on smart city planning, urban development, or big data analysis. Useful for illustrating concepts in architecture, engineering, or technological advancements in managing urban spaces.
Powered by  - Get 15% off with code: PIKWIZARD15


downloads
Tags:
More
Credit Photo
If you would like to credit the Photo, here are some ways you can do so
Text Link
photo Link
<span class="text-link">
<span>
<a target="_blank" href=https://pikwizard.com/photo/digital-3d-blueprint-city-with-dynamic-graph-statistics/1ddceaff8fdb507f602f3d6fcbc9ee3c/>PikWizard</a>
</span>
</span>
<span class="image-link">
<span
style="margin: 0 0 20px 0; display: inline-block; vertical-align: middle; width: 100%;"
>
<a
target="_blank"
href="https://pikwizard.com/photo/digital-3d-blueprint-city-with-dynamic-graph-statistics/1ddceaff8fdb507f602f3d6fcbc9ee3c/"
style="text-decoration: none; font-size: 10px; margin: 0;"
>
<img src="https://pikwizard.com/pw/medium/1ddceaff8fdb507f602f3d6fcbc9ee3c.jpg" style="margin: 0; width: 100%;" alt="" />
<p style="font-size: 12px; margin: 0;">PikWizard</p>
</a>
</span>
</span>
Free (free of charge)
Free for personal and commercial use.
Author: Authentic Images
Similar Free Stock Images

Premium


Premium


Premium

Premium


Premium


Premium


Premium

Premium

Premium

Premium


Premium


Premium

Premium

Premium


Premium


Premium

Premium

Premium


Premium


Premium


Premium


Premium


Premium

Premium

Premium


Explore More Free Stock Images