- Home >
- Stock Photos >
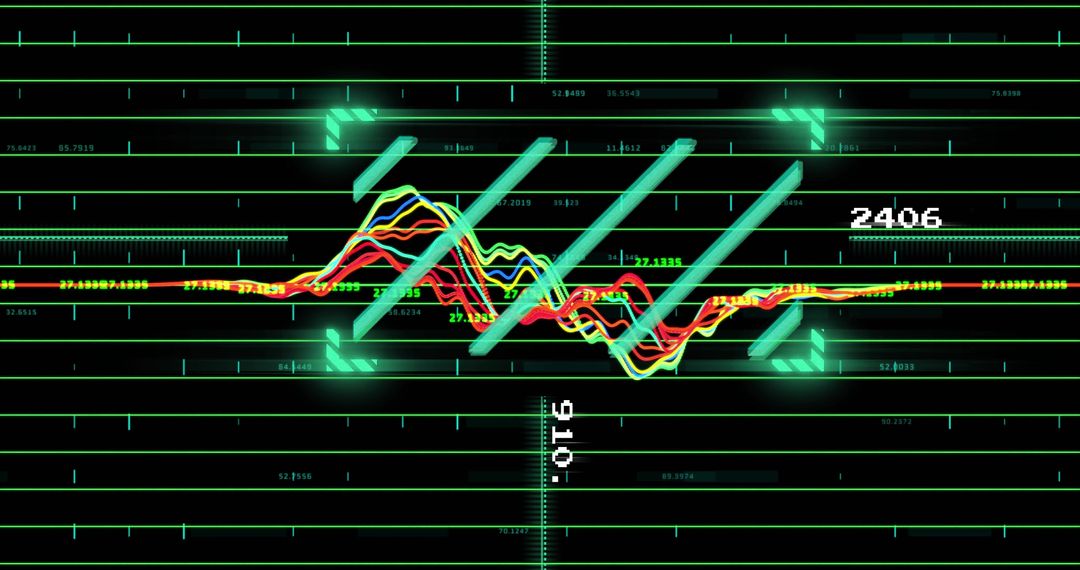
- Digital Abstract Graph Showing Financial Growth and Currency Analysis
Digital Abstract Graph Showing Financial Growth and Currency Analysis Image

Illustration shows an abstract digital graph with various currency symbols and numbers, representing financial analysis and economic trends. Brightly colored elements highlight currency fluctuations and growth markers against a data-driven backdrop, ideal for use in financial reports, technology blogs, presentations on economic growth, and analytic software themes.
Powered by  - Get 15% off with code: PIKWIZARD15


8
downloads
downloads
Tags:
More
Credit Photo
If you would like to credit the Photo, here are some ways you can do so
Text Link
photo Link
<span class="text-link">
<span>
<a target="_blank" href=https://pikwizard.com/photo/digital-abstract-graph-showing-financial-growth-and-currency-analysis/44e47963881c6250ffe70756bf168bed/>PikWizard</a>
</span>
</span>
<span class="image-link">
<span
style="margin: 0 0 20px 0; display: inline-block; vertical-align: middle; width: 100%;"
>
<a
target="_blank"
href="https://pikwizard.com/photo/digital-abstract-graph-showing-financial-growth-and-currency-analysis/44e47963881c6250ffe70756bf168bed/"
style="text-decoration: none; font-size: 10px; margin: 0;"
>
<img src="https://pikwizard.com/pw/medium/44e47963881c6250ffe70756bf168bed.jpg" style="margin: 0; width: 100%;" alt="" />
<p style="font-size: 12px; margin: 0;">PikWizard</p>
</a>
</span>
</span>
Free (free of charge)
Free for personal and commercial use.
Author: Authentic Images
Similar Free Stock Images

Premium


Premium


Premium


Premium


Premium


Premium


Premium


Premium


Premium


Premium


Premium


Premium


Premium


Premium


Premium


Premium


Premium


Premium


Premium


Premium


Premium


Premium


Premium


Premium