
- Home >
- Stock Photos >
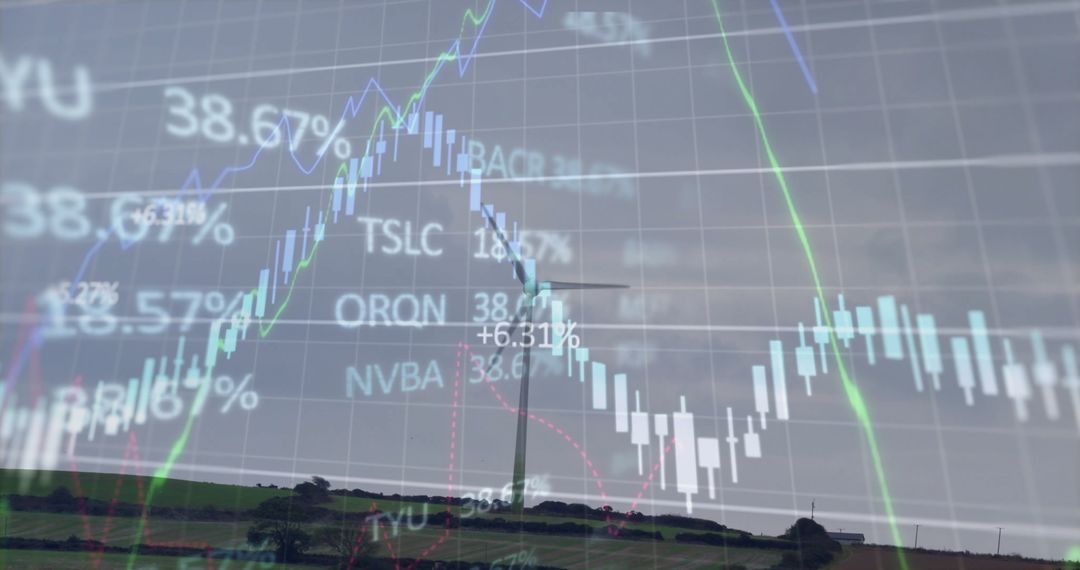
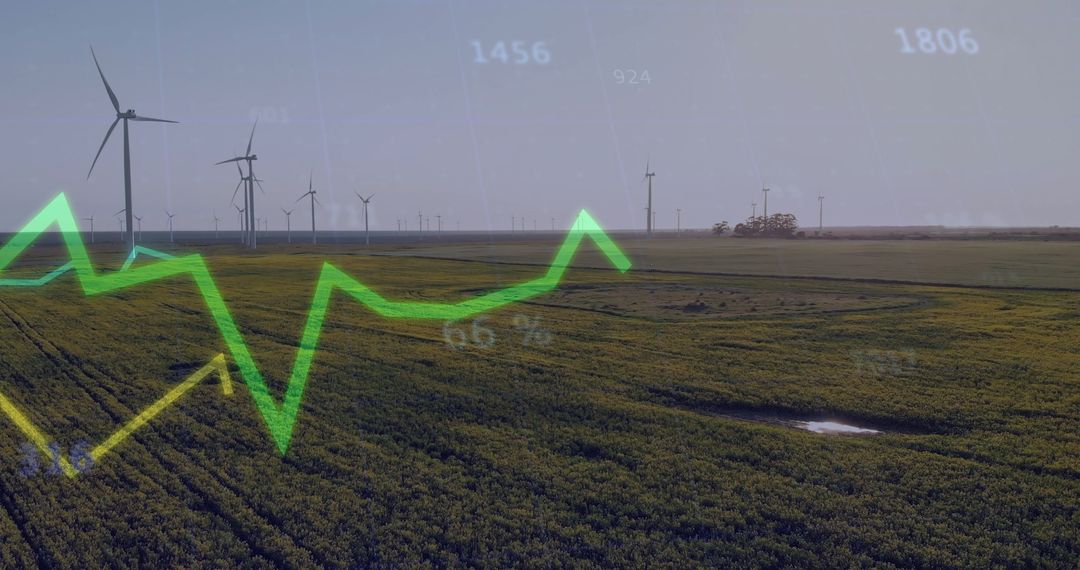
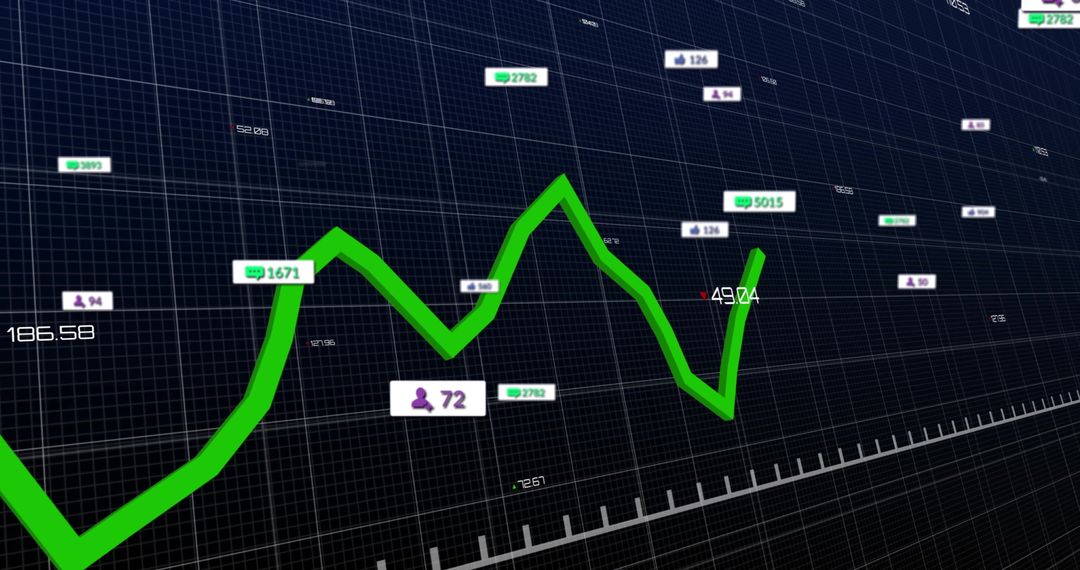
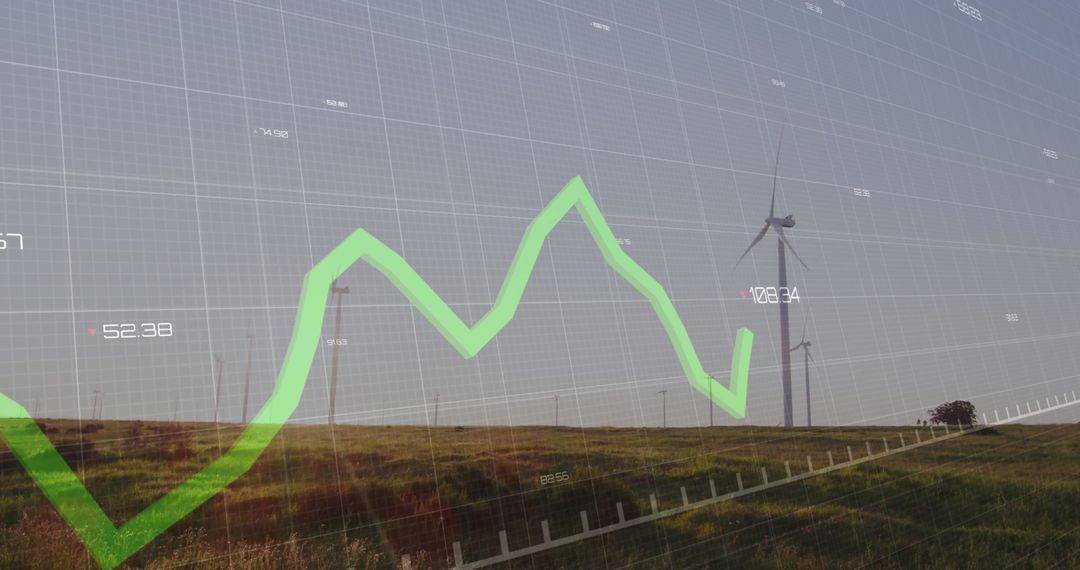
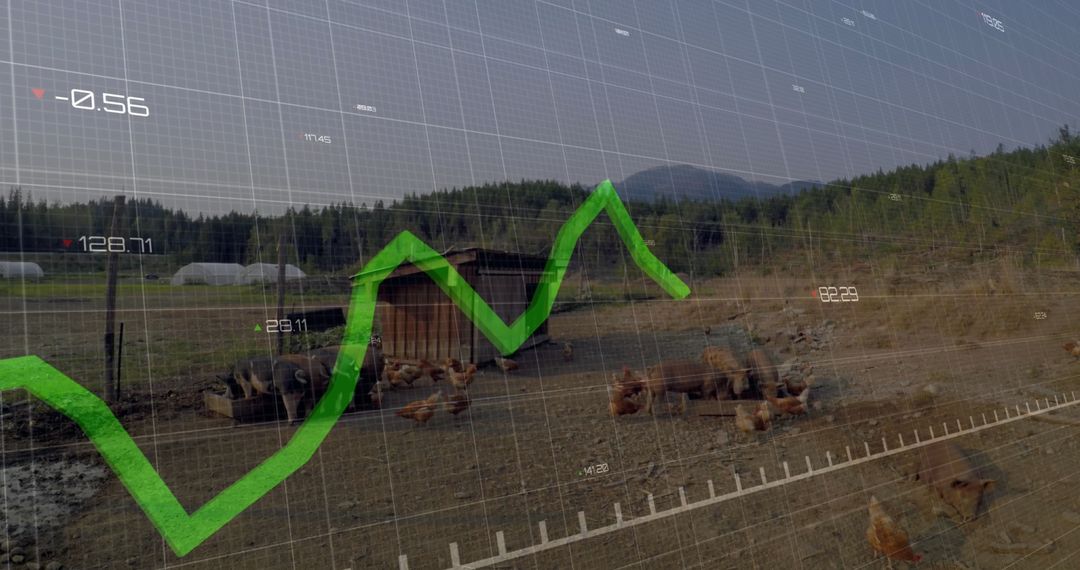
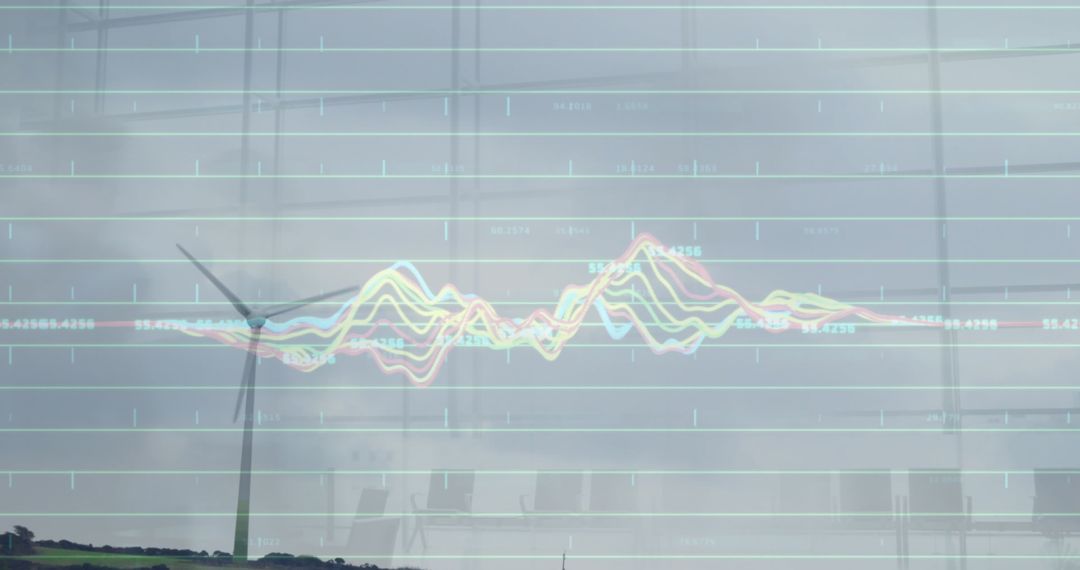
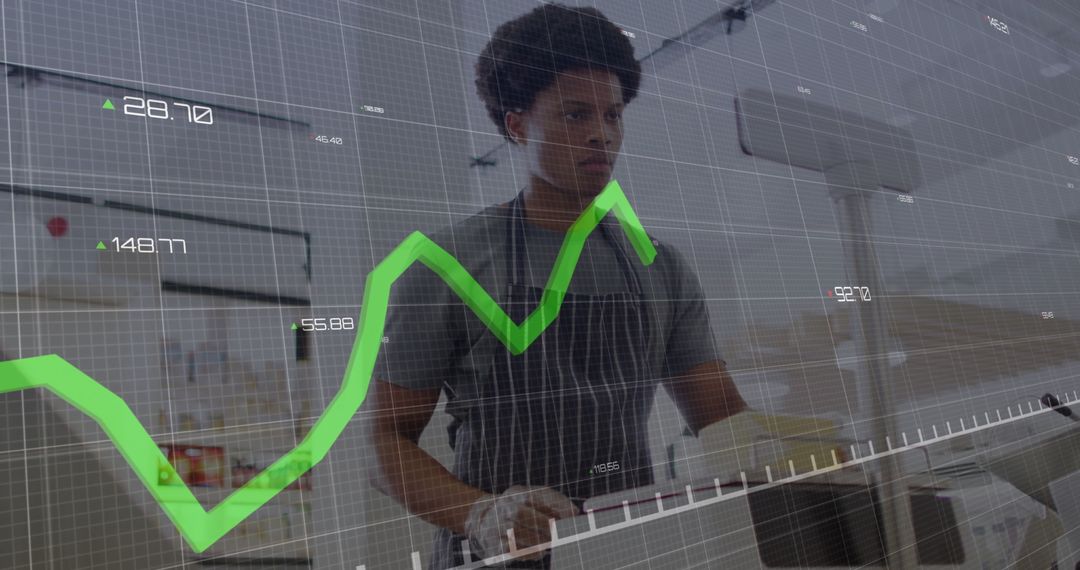
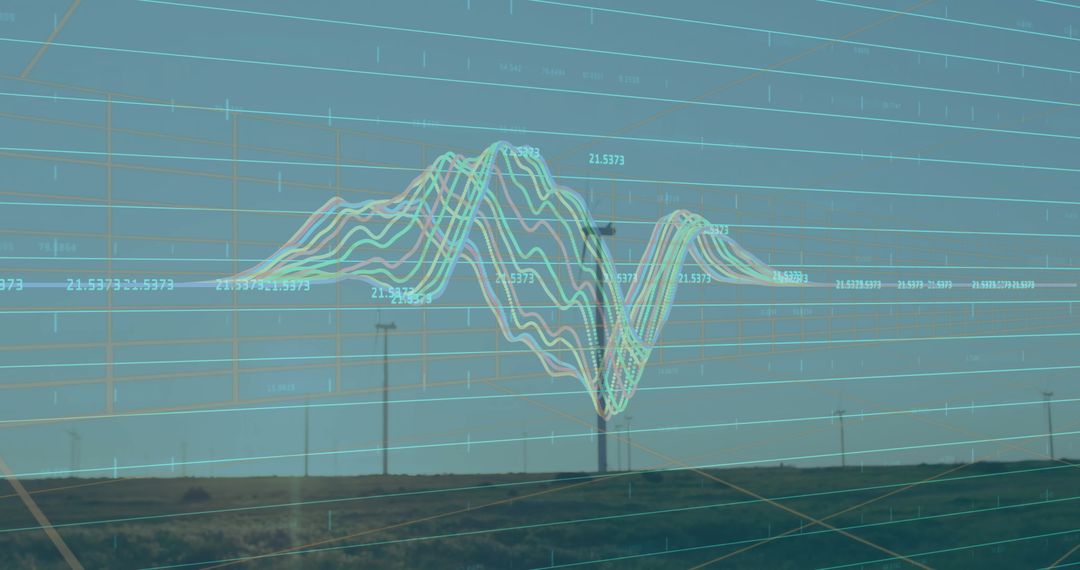
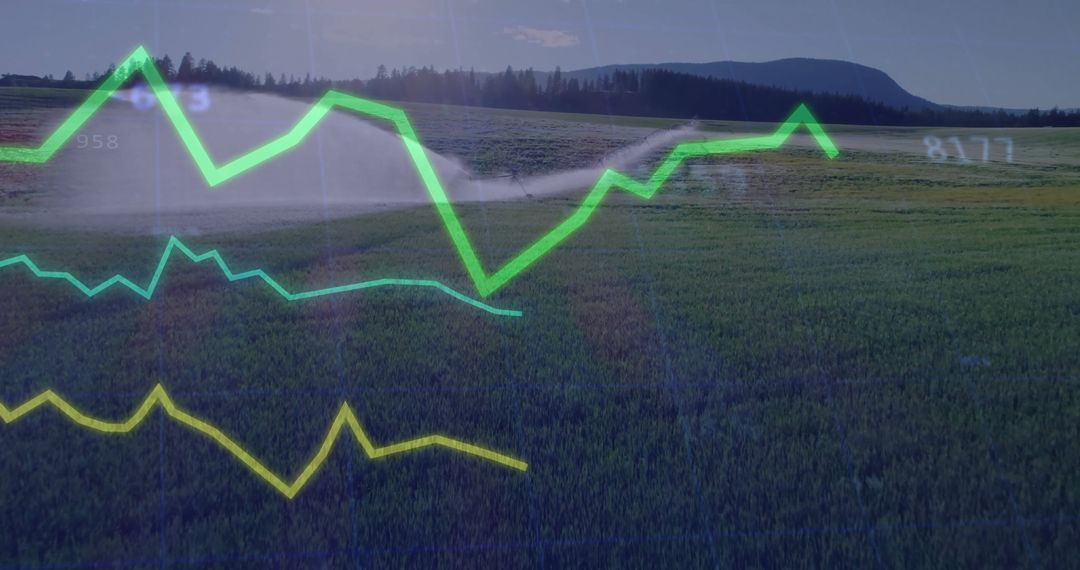
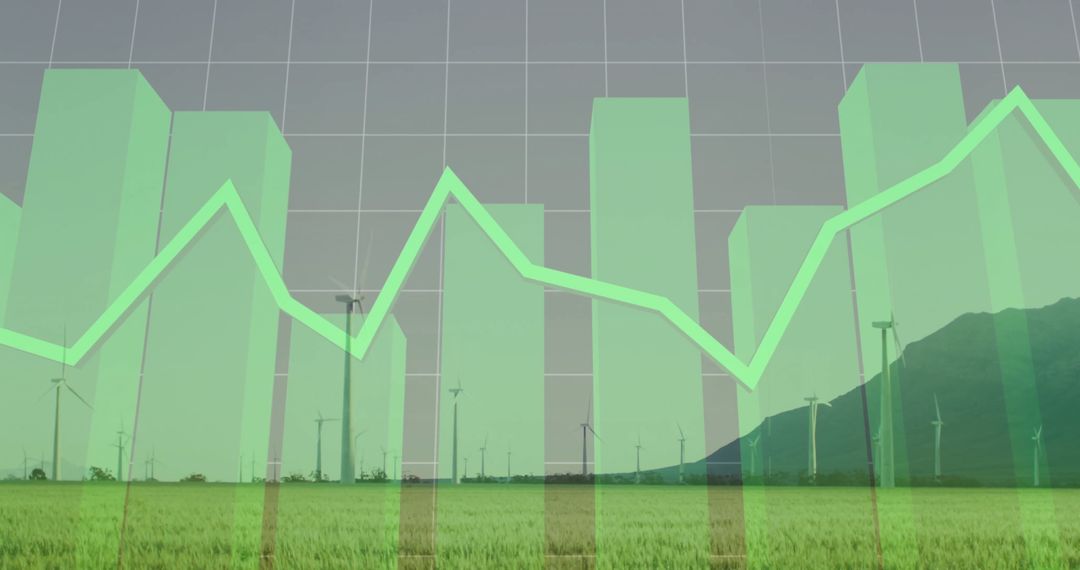
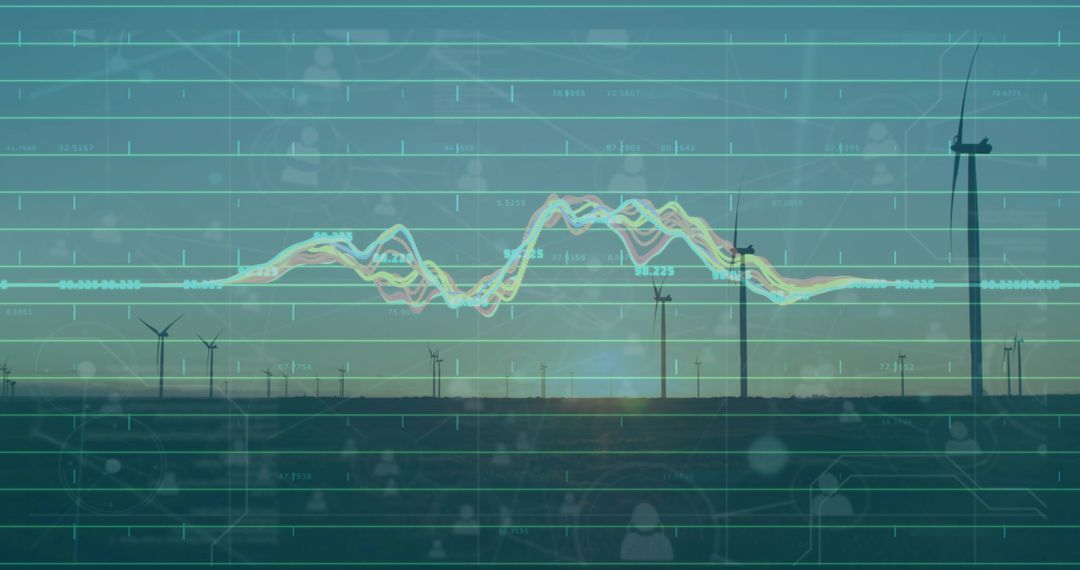
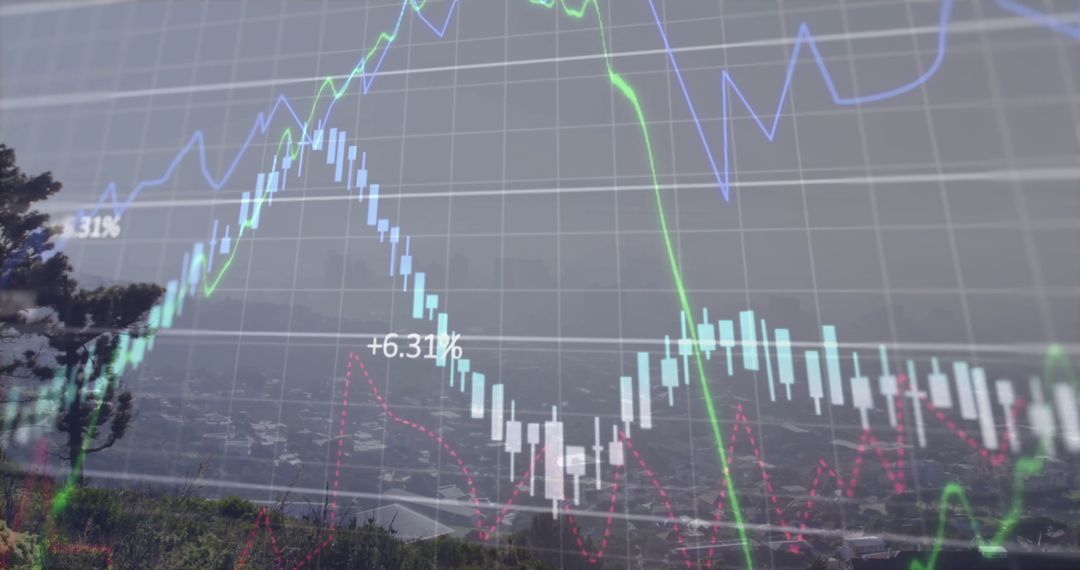
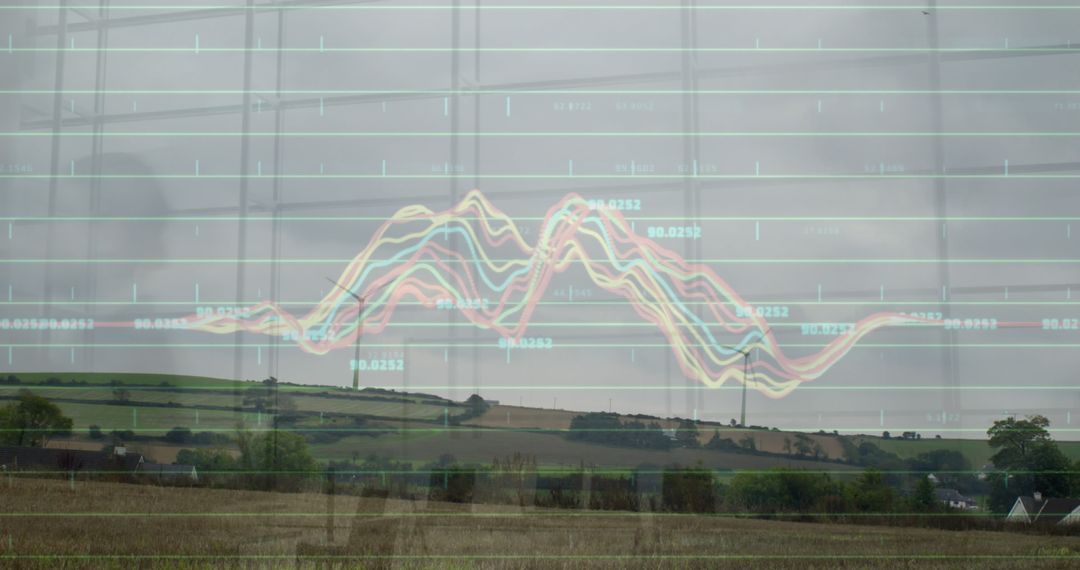
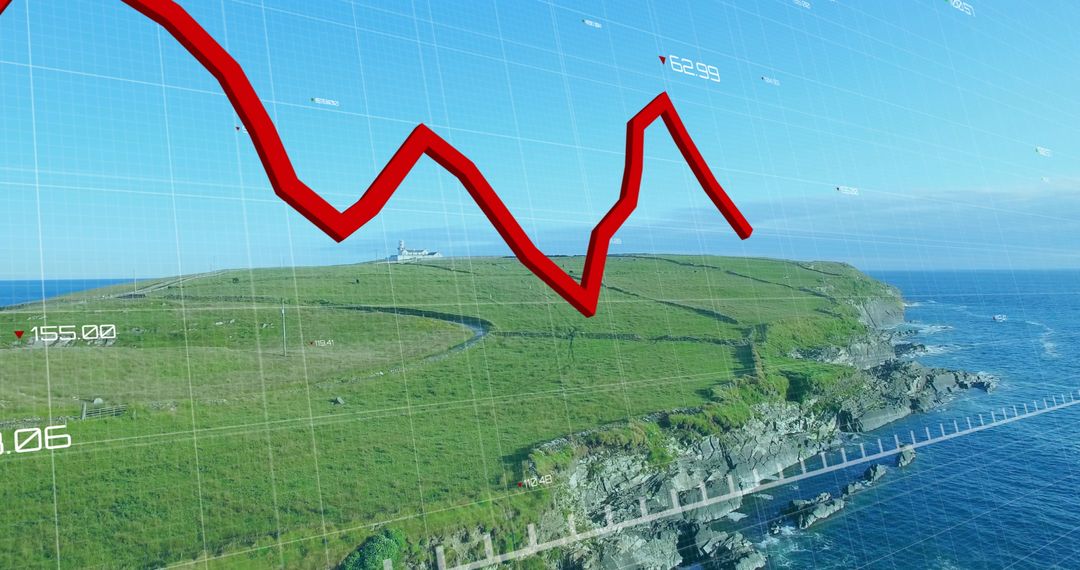
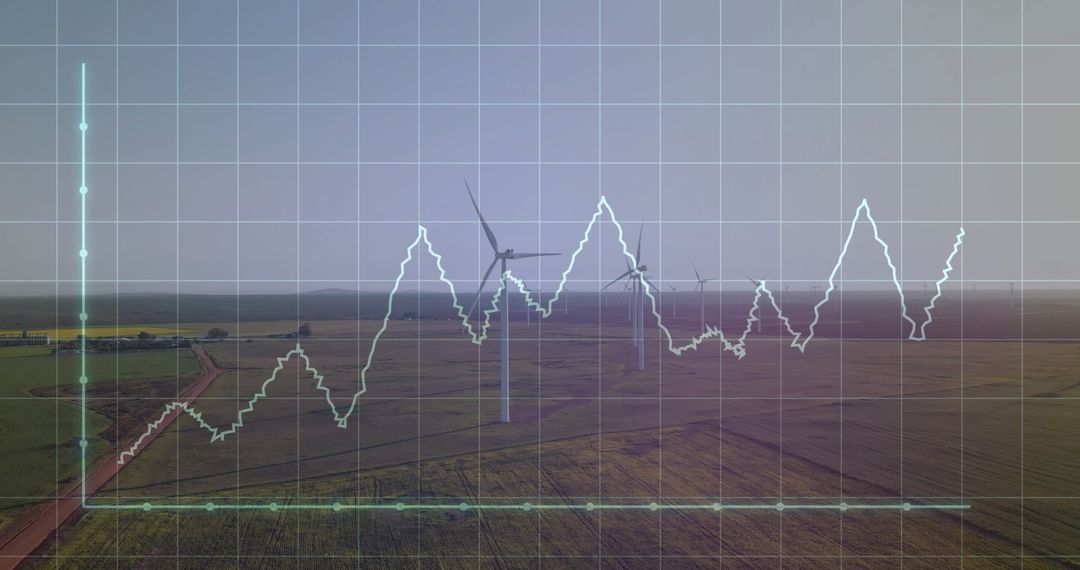
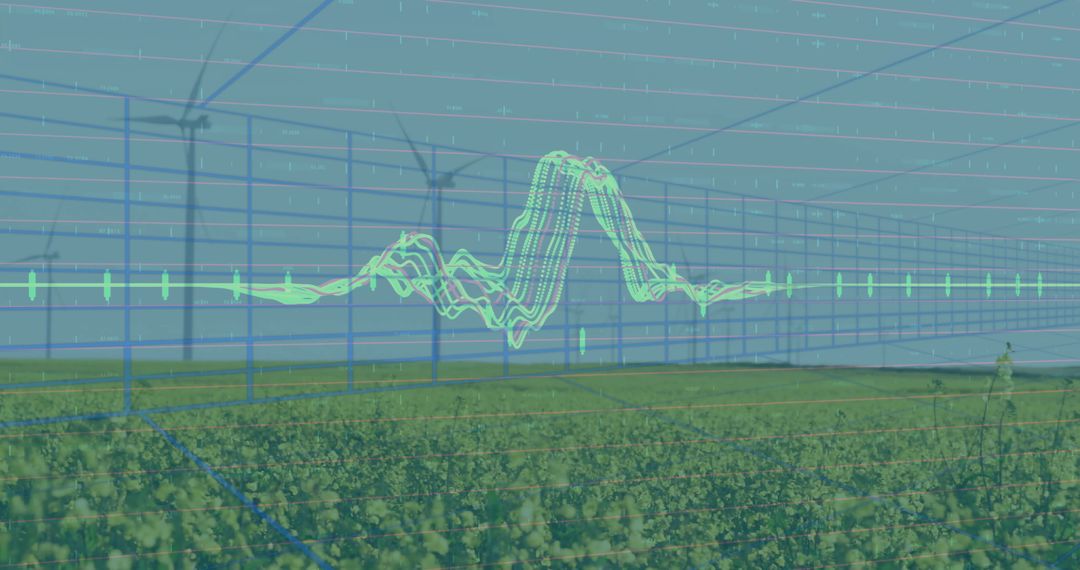
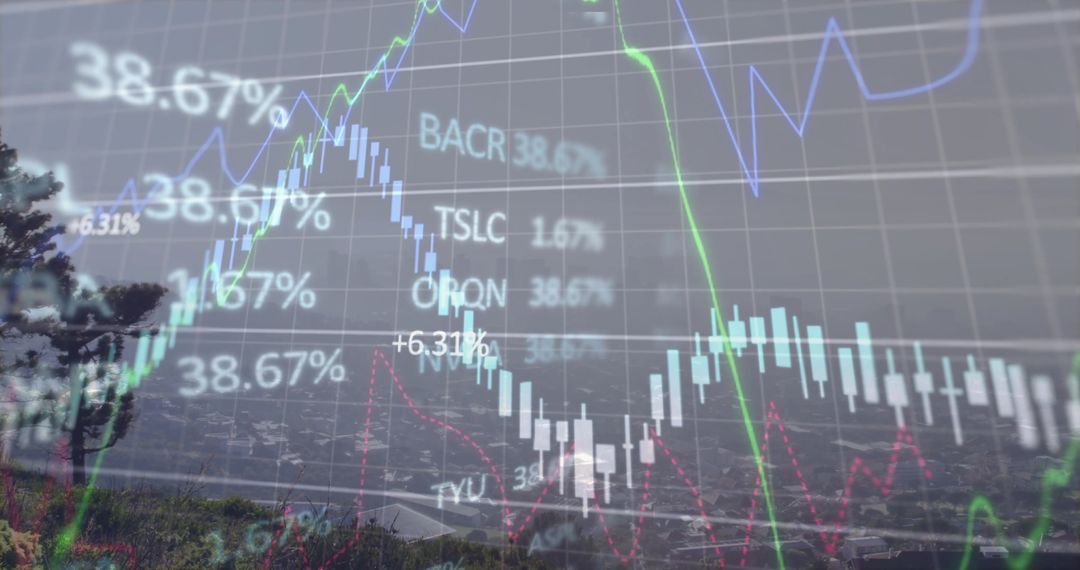
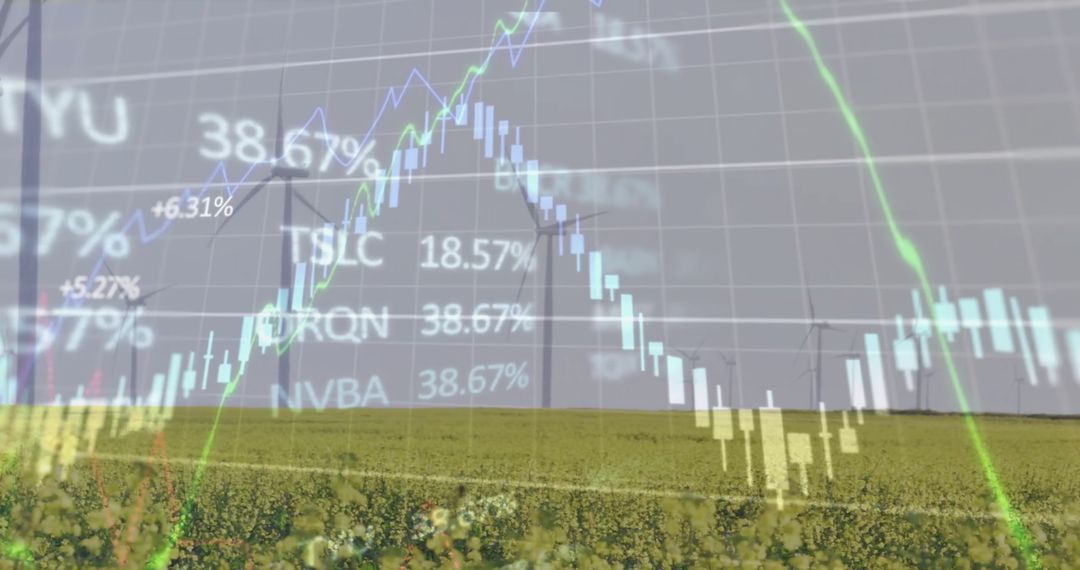
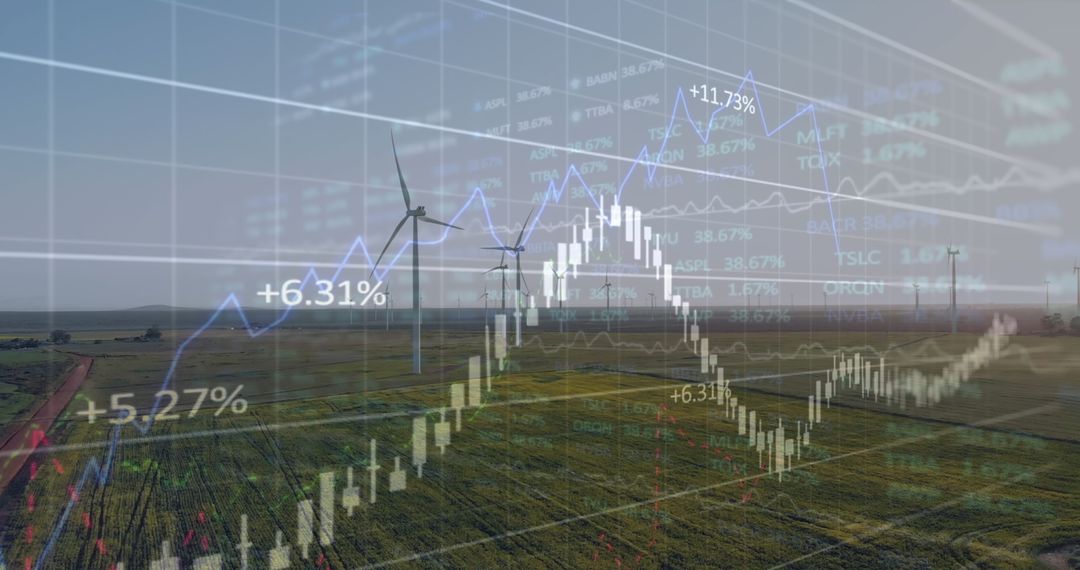
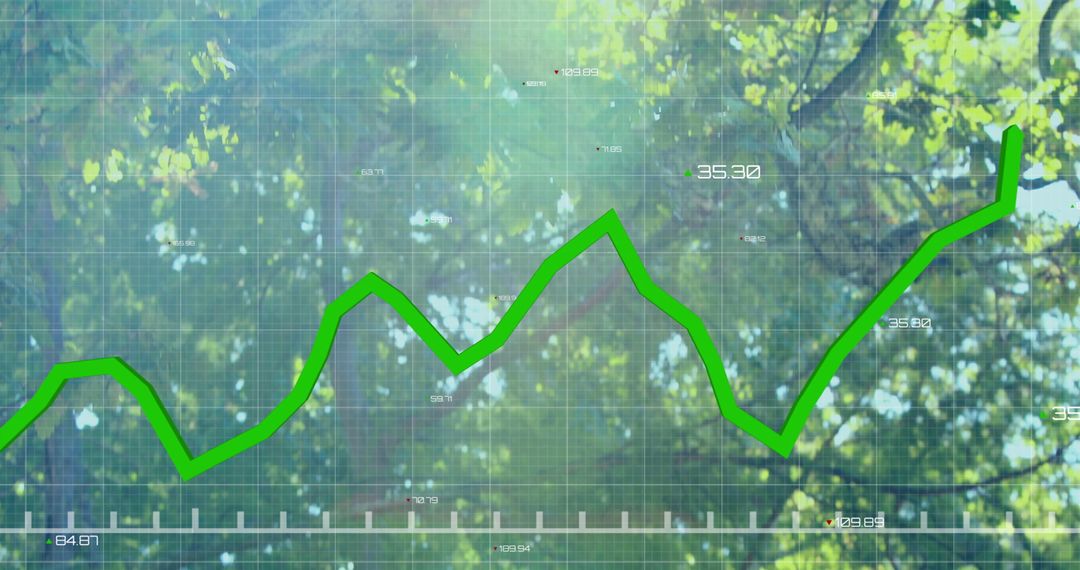
- Digital Agriculture and Data Visualization in a Rural Landscape
Digital Agriculture and Data Visualization in a Rural Landscape Image
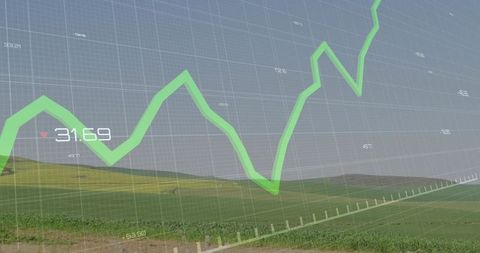
Displaying a digital theme with a juxtaposition of a rural landscape backdropped by a technological data overlay concept. Green trendlines and numerical labels suggest insights into agriculture and economy analytics. Useful for topics on sustainable farming, economic modeling, impact of weather patterns on agriculture, and curriculum involving agribusiness technology improvements.
Powered by  - Get 15% off with code: PIKWIZARD15


0
downloads
downloads
Tags:
More
Credit Photo
If you would like to credit the Photo, here are some ways you can do so
Text Link
photo Link
<span class="text-link">
<span>
<a target="_blank" href=https://pikwizard.com/photo/digital-agriculture-and-data-visualization-in-a-rural-landscape/1b013759a24f4ce79c54689b18b29a7d/>PikWizard</a>
</span>
</span>
<span class="image-link">
<span
style="margin: 0 0 20px 0; display: inline-block; vertical-align: middle; width: 100%;"
>
<a
target="_blank"
href="https://pikwizard.com/photo/digital-agriculture-and-data-visualization-in-a-rural-landscape/1b013759a24f4ce79c54689b18b29a7d/"
style="text-decoration: none; font-size: 10px; margin: 0;"
>
<img src="https://pikwizard.com/pw/medium/1b013759a24f4ce79c54689b18b29a7d.jpg" style="margin: 0; width: 100%;" alt="" />
<p style="font-size: 12px; margin: 0;">PikWizard</p>
</a>
</span>
</span>
Free (free of charge)
Free for personal and commercial use.
Author: Authentic Images
Similar Free Stock Images

Premium


Premium


Premium


Premium


Premium


Premium


Premium


Premium


Premium


Premium

Premium


Premium


Premium


Premium


Premium


Premium


Premium


Premium


Premium


Premium


Premium


Premium


Premium


Premium

