- Home >
- Stock Photos >
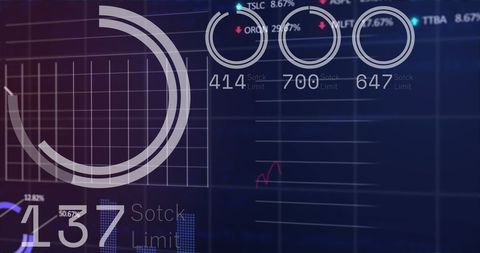
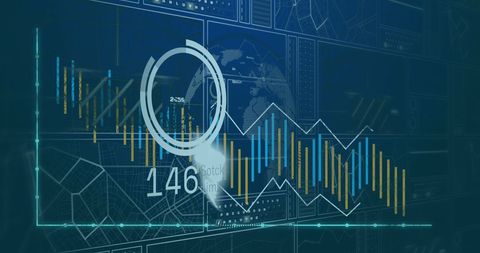
- Digital Analysis Concept with Data Scanning
Digital Analysis Concept with Data Scanning Image
Visual embodies modern data analysis technology, with focus on dynamic scanning tools. Ideal for conveying ideas about financial market analysis, stock trading, economic trends, and technological advancement in business applications. Suitable for use in presentations, reports, and educational materials on digital transformation and economic data visualization.

downloads
Tags:
More
Credit Photo
If you would like to credit the Photo, here are some ways you can do so
Text Link
photo Link
<span class="text-link">
<span>
<a target="_blank" href=https://pikwizard.com/photo/digital-analysis-concept-with-data-scanning/a8968dba2b0cd18561415d5fa16af2a8/>PikWizard</a>
</span>
</span>
<span class="image-link">
<span
style="margin: 0 0 20px 0; display: inline-block; vertical-align: middle; width: 100%;"
>
<a
target="_blank"
href="https://pikwizard.com/photo/digital-analysis-concept-with-data-scanning/a8968dba2b0cd18561415d5fa16af2a8/"
style="text-decoration: none; font-size: 10px; margin: 0;"
>
<img src="https://pikwizard.com/pw/medium/a8968dba2b0cd18561415d5fa16af2a8.jpg" style="margin: 0; width: 100%;" alt="" />
<p style="font-size: 12px; margin: 0;">PikWizard</p>
</a>
</span>
</span>
Free (free of charge)
Free for personal and commercial use.
Author: People Creations