- Home >
- Stock Photos >
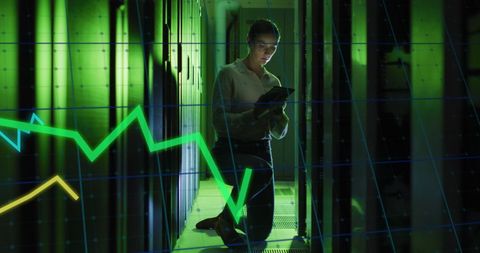
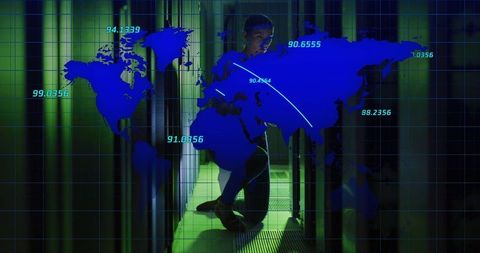
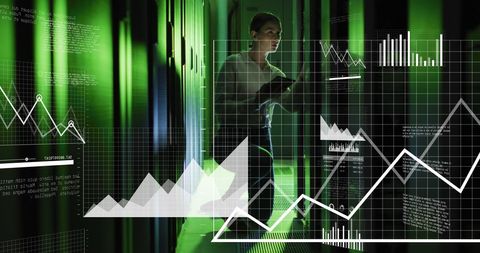
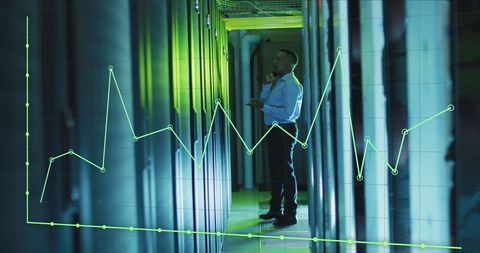
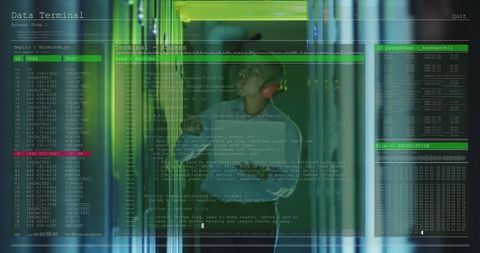
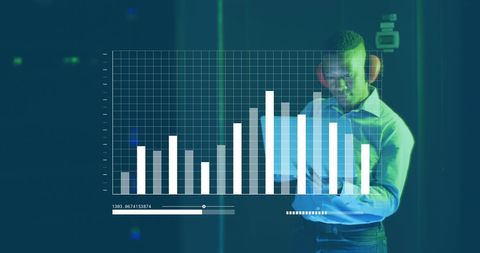
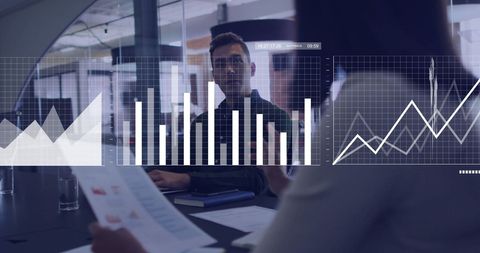
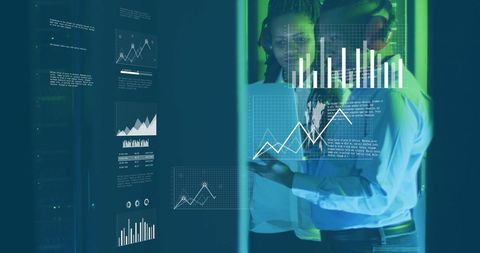
- Digital Analysis Overlays Technology Professional in Server Room
Digital Analysis Overlays Technology Professional in Server Room Image

Digital overlays of charts and graphs over a male IT professional working in a server room. Depicts concepts of data analysis and technology usage in modern workplaces. Ideal for illustrating IT systems, digital transformation, data privacy awareness or tech industry success in presentations and reports.
Powered by  - Get 15% off with code: PIKWIZARD15


2
downloads
downloads
Tags:
More
Credit Photo
If you would like to credit the Photo, here are some ways you can do so
Text Link
photo Link
<span class="text-link">
<span>
<a target="_blank" href=https://pikwizard.com/photo/digital-analysis-overlays-technology-professional-in-server-room/ae6ced37b7dc184ab6642af97a38fc83/>PikWizard</a>
</span>
</span>
<span class="image-link">
<span
style="margin: 0 0 20px 0; display: inline-block; vertical-align: middle; width: 100%;"
>
<a
target="_blank"
href="https://pikwizard.com/photo/digital-analysis-overlays-technology-professional-in-server-room/ae6ced37b7dc184ab6642af97a38fc83/"
style="text-decoration: none; font-size: 10px; margin: 0;"
>
<img src="https://pikwizard.com/pw/medium/ae6ced37b7dc184ab6642af97a38fc83.jpg" style="margin: 0; width: 100%;" alt="" />
<p style="font-size: 12px; margin: 0;">PikWizard</p>
</a>
</span>
</span>
Free (free of charge)
Free for personal and commercial use.
Author: People Creations
Similar Free Stock Images

Premium


Premium


Premium


Premium


Premium


Premium


Premium


Premium


Premium


Premium


Premium


Premium


Premium


Premium


Premium


Premium


Premium


Premium


Premium


Premium


Premium


Premium


Premium


Premium


Premium