
- Home >
- Stock Photos >
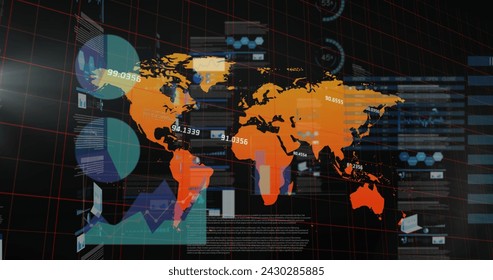
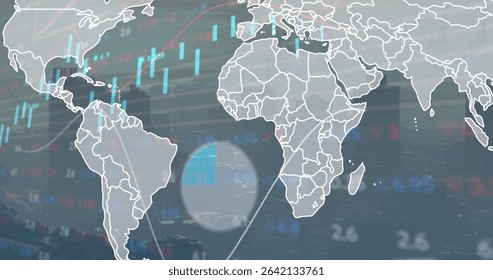
- Digital Analysis with Graphs and World Map in Dynamic Visual
Digital Analysis with Graphs and World Map in Dynamic Visual Image

Diagrams and world map creating a technologically advanced vibe ideal for illustrating global data networks and digital analysis. This design is perfect for use in presentations, blogs, and articles about internet security, global communication, and advanced analytics processes.
Powered by  - Get 15% off with code: PIKWIZARD15


downloads
Tags:
More
Credit Photo
If you would like to credit the Photo, here are some ways you can do so
Text Link
photo Link
<span class="text-link">
<span>
<a target="_blank" href=https://pikwizard.com/photo/digital-analysis-with-graphs-and-world-map-in-dynamic-visual/f7e5f2ec7b9f914d03950d4649949152/>PikWizard</a>
</span>
</span>
<span class="image-link">
<span
style="margin: 0 0 20px 0; display: inline-block; vertical-align: middle; width: 100%;"
>
<a
target="_blank"
href="https://pikwizard.com/photo/digital-analysis-with-graphs-and-world-map-in-dynamic-visual/f7e5f2ec7b9f914d03950d4649949152/"
style="text-decoration: none; font-size: 10px; margin: 0;"
>
<img src="https://pikwizard.com/pw/medium/f7e5f2ec7b9f914d03950d4649949152.jpg" style="margin: 0; width: 100%;" alt="" />
<p style="font-size: 12px; margin: 0;">PikWizard</p>
</a>
</span>
</span>
Free (free of charge)
Free for personal and commercial use.
Author: Authentic Images
Similar Free Stock Images

Premium


Premium

Premium


Premium


Premium


Premium


Premium


Premium


Premium


Premium


Premium


Premium


Premium


Premium

Premium


Premium


Premium


Premium


Premium


Premium


Premium


Premium


Premium


Premium


Premium


Explore More Free Stock Images