
- Home >
- Stock Photos >
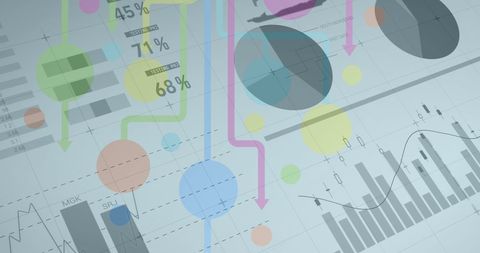
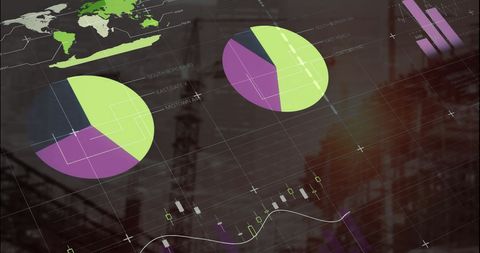
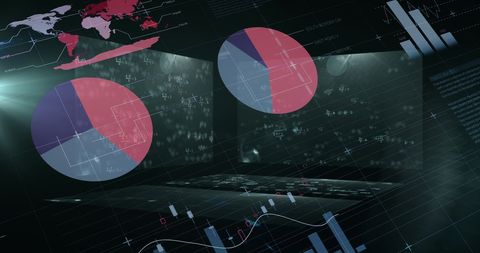
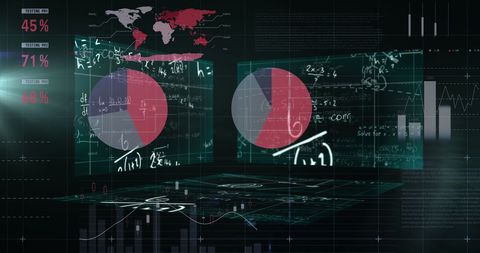
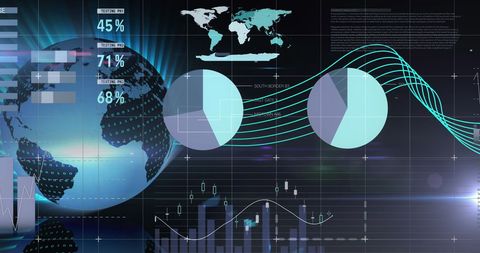
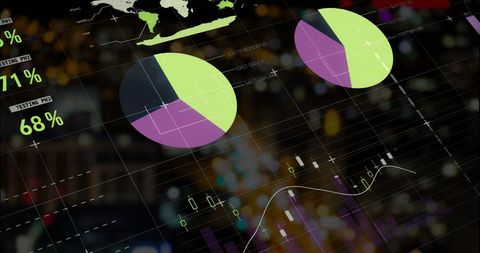
- Digital Analytics and Global Financial Data Visualization
Digital Analytics and Global Financial Data Visualization Image

Digital thematic elements representing technological advancements in financial data processing. This futuristic scene features global maps, network connections, pie charts, and bar graphs to convey complex data analytics in a comprehensive manner. Ideal for illustrating themes in finance, data science, technology articles, or educational presentations.
Powered by 


downloads
Tags:
More
Credit Photo
If you would like to credit the Photo, here are some ways you can do so
Text Link
photo Link
<span class="text-link">
<span>
<a target="_blank" href=https://pikwizard.com/photo/digital-analytics-and-global-financial-data-visualization/0427f748b635f573ca1c01d3969a5235/>PikWizard</a>
</span>
</span>
<span class="image-link">
<span
style="margin: 0 0 20px 0; display: inline-block; vertical-align: middle; width: 100%;"
>
<a
target="_blank"
href="https://pikwizard.com/photo/digital-analytics-and-global-financial-data-visualization/0427f748b635f573ca1c01d3969a5235/"
style="text-decoration: none; font-size: 10px; margin: 0;"
>
<img src="https://pikwizard.com/pw/medium/0427f748b635f573ca1c01d3969a5235.jpg" style="margin: 0; width: 100%;" alt="" />
<p style="font-size: 12px; margin: 0;">PikWizard</p>
</a>
</span>
</span>
Free (free of charge)
Free for personal and commercial use.
Author: People Creations
Similar Free Stock Images

Premium


Premium


Premium

Premium


Premium


Premium

Premium


Premium


Premium


Premium


Premium


Premium


Premium

Premium

Premium


Premium


Premium

Premium

Premium

Premium


Premium


Premium


Premium


Premium


Premium
Explore More Free Stock Images