- Home >
- Stock Photos >
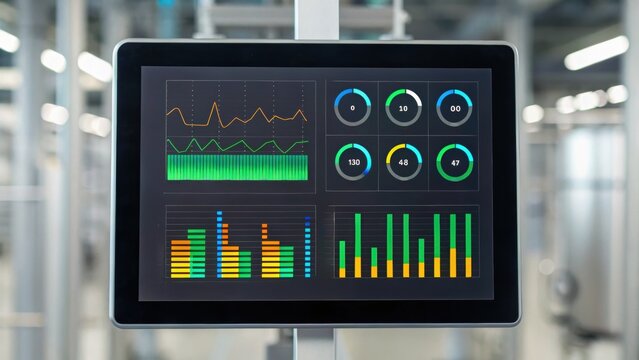
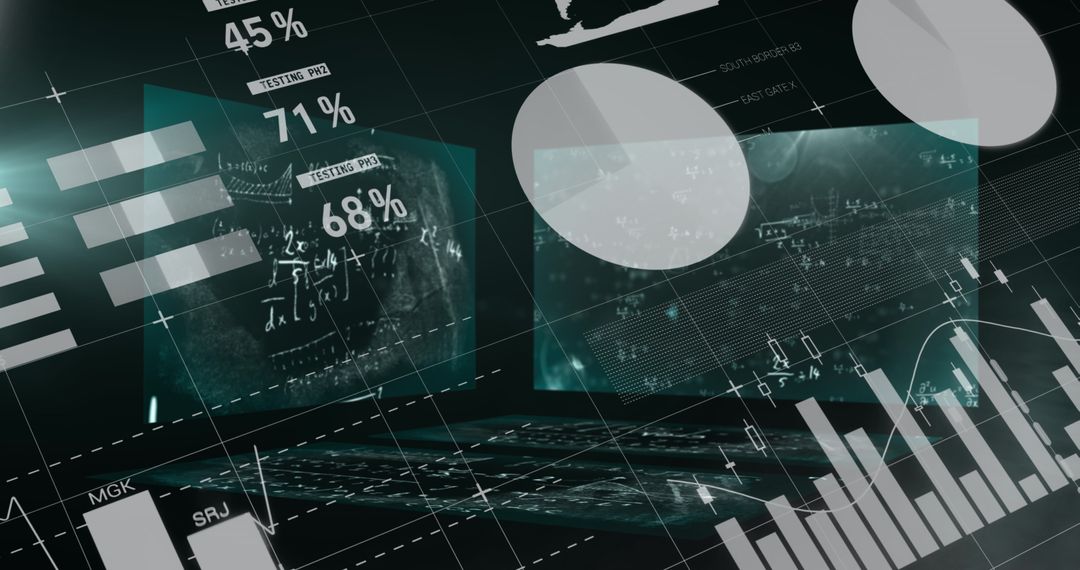
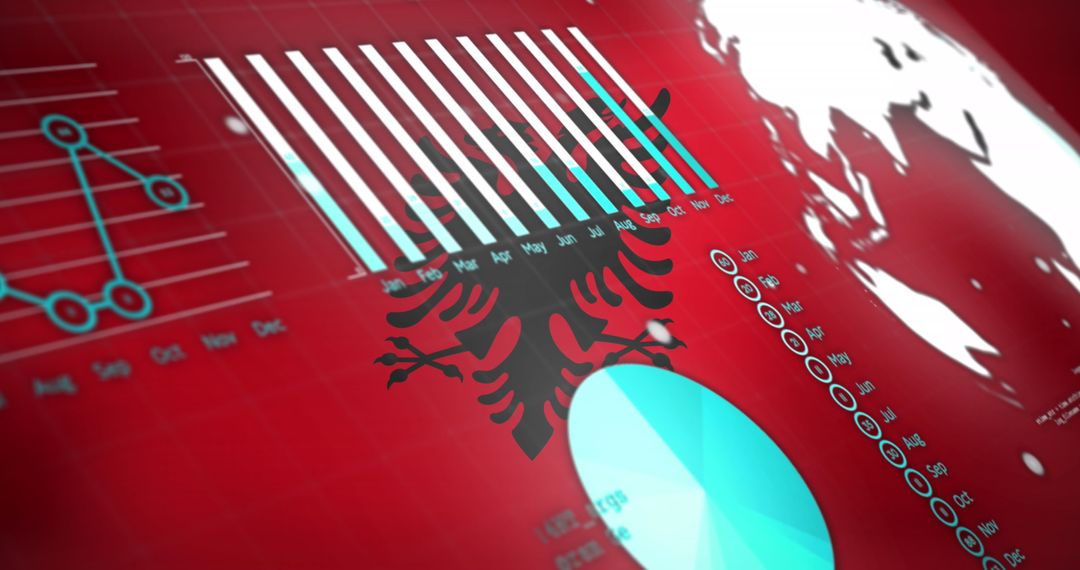
- Digital Analytics Dashboard with Bar and Pie Charts
Digital Analytics Dashboard with Bar and Pie Charts Image

This shows a modern analytics dashboard featuring bar and pie charts combined with blurred code on a computer screen, illustrating the integration of data visualization and programming. Ideal for articles about technology-driven statistical analysis, performance monitoring, or software development. Useful as a background for presentations or websites focused on tech innovation and data management.
Powered by 


0
downloads
downloads
Tags:
More
Credit Photo
If you would like to credit the Photo, here are some ways you can do so
Text Link
photo Link
<span class="text-link">
<span>
<a target="_blank" href=https://pikwizard.com/photo/digital-analytics-dashboard-with-bar-and-pie-charts/374c96712d4122531abee0c3dd649c44/>PikWizard</a>
</span>
</span>
<span class="image-link">
<span
style="margin: 0 0 20px 0; display: inline-block; vertical-align: middle; width: 100%;"
>
<a
target="_blank"
href="https://pikwizard.com/photo/digital-analytics-dashboard-with-bar-and-pie-charts/374c96712d4122531abee0c3dd649c44/"
style="text-decoration: none; font-size: 10px; margin: 0;"
>
<img src="https://pikwizard.com/pw/medium/374c96712d4122531abee0c3dd649c44.jpg" style="margin: 0; width: 100%;" alt="" />
<p style="font-size: 12px; margin: 0;">PikWizard</p>
</a>
</span>
</span>
Free (free of charge)
Free for personal and commercial use.
Author: Authentic Images
Similar Free Stock Images

Premium


Premium


Premium


Premium


Premium


Premium


Premium


Premium


Premium


Premium


Premium


Premium


Premium


Premium


Premium


Premium


Premium


Premium


Premium


Premium


Premium


Premium


Premium


Premium