
- Home >
- Stock Photos >
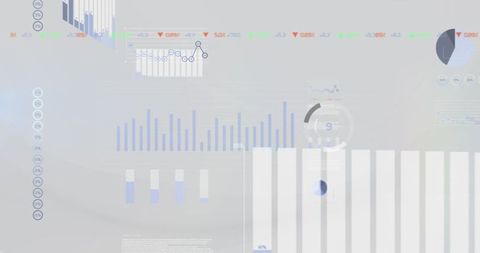
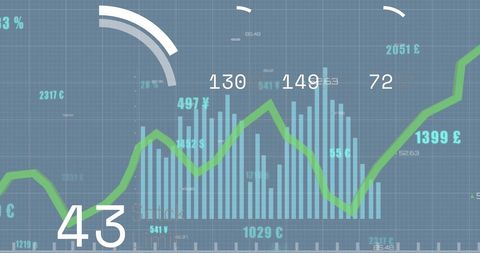
- Digital Analytics Dashboard with Bar Chart and Data Visualization
Digital Analytics Dashboard with Bar Chart and Data Visualization Image
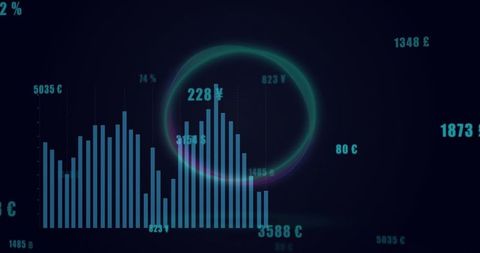
Visual representation of financial data using bar chart in an analytics dashboard. Colors and pattern suggest technology theme and are ideal for applications involving digital finance and market analysis. Perfect for use in business presentations, financial reports, and technology guides related to data analytics and visualization tools.
Powered by  - Get 15% off with code: PIKWIZARD15


downloads
Tags:
More
Credit Photo
If you would like to credit the Photo, here are some ways you can do so
Text Link
photo Link
<span class="text-link">
<span>
<a target="_blank" href=https://pikwizard.com/photo/digital-analytics-dashboard-with-bar-chart-and-data-visualization/965c4a8f5cc1c00910c7ed1d215392d4/>PikWizard</a>
</span>
</span>
<span class="image-link">
<span
style="margin: 0 0 20px 0; display: inline-block; vertical-align: middle; width: 100%;"
>
<a
target="_blank"
href="https://pikwizard.com/photo/digital-analytics-dashboard-with-bar-chart-and-data-visualization/965c4a8f5cc1c00910c7ed1d215392d4/"
style="text-decoration: none; font-size: 10px; margin: 0;"
>
<img src="https://pikwizard.com/pw/medium/965c4a8f5cc1c00910c7ed1d215392d4.jpg" style="margin: 0; width: 100%;" alt="" />
<p style="font-size: 12px; margin: 0;">PikWizard</p>
</a>
</span>
</span>
Free (free of charge)
Free for personal and commercial use.
Author: Awesome Content
Similar Free Stock Images

Premium


Premium

Premium


Premium

Premium


Premium


Premium


Premium


Premium


Premium


Premium


Premium


Premium


Premium


Premium


Premium


Premium


Premium


Premium


Premium


Premium


Premium


Premium


Premium


Premium


Explore More Free Stock Images