
- Home >
- Stock Photos >
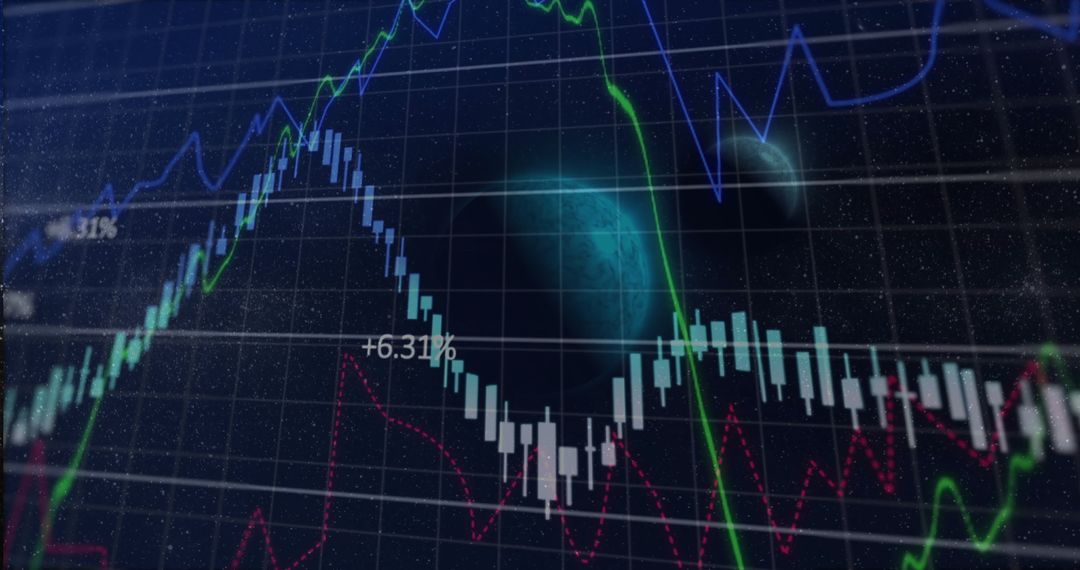
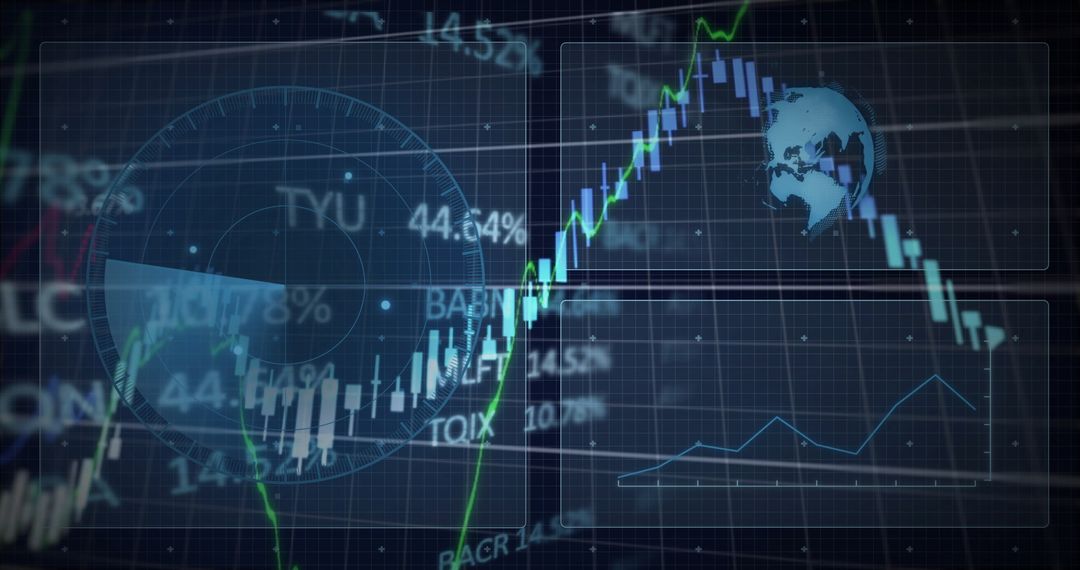
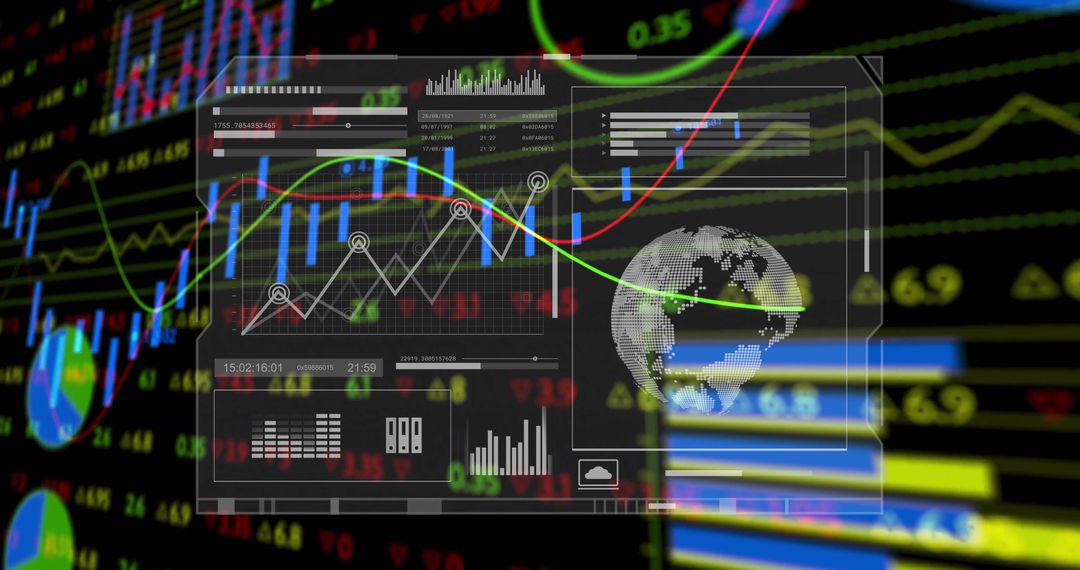
- Digital Analytics Dashboard with Candlestick Chart and Globe Icon
Digital Analytics Dashboard with Candlestick Chart and Globe Icon Image
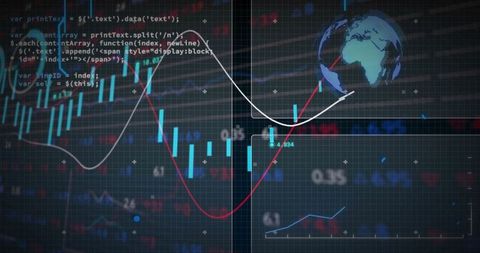
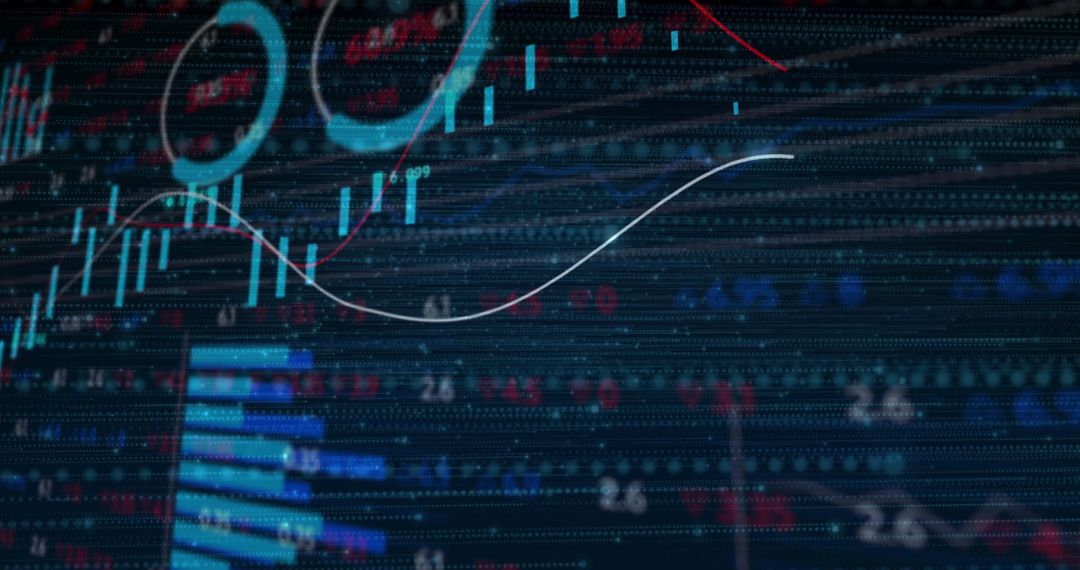
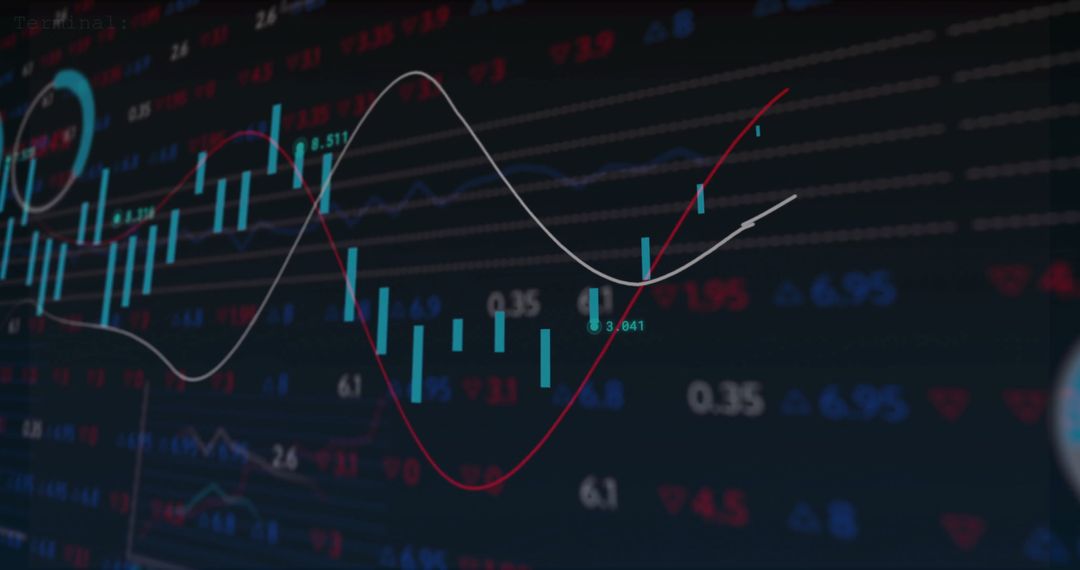
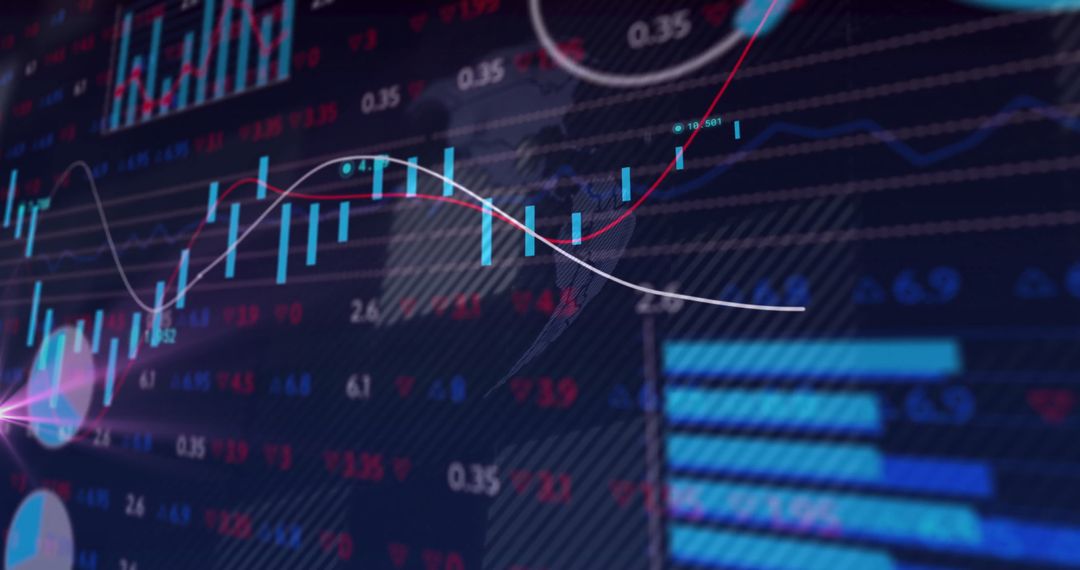
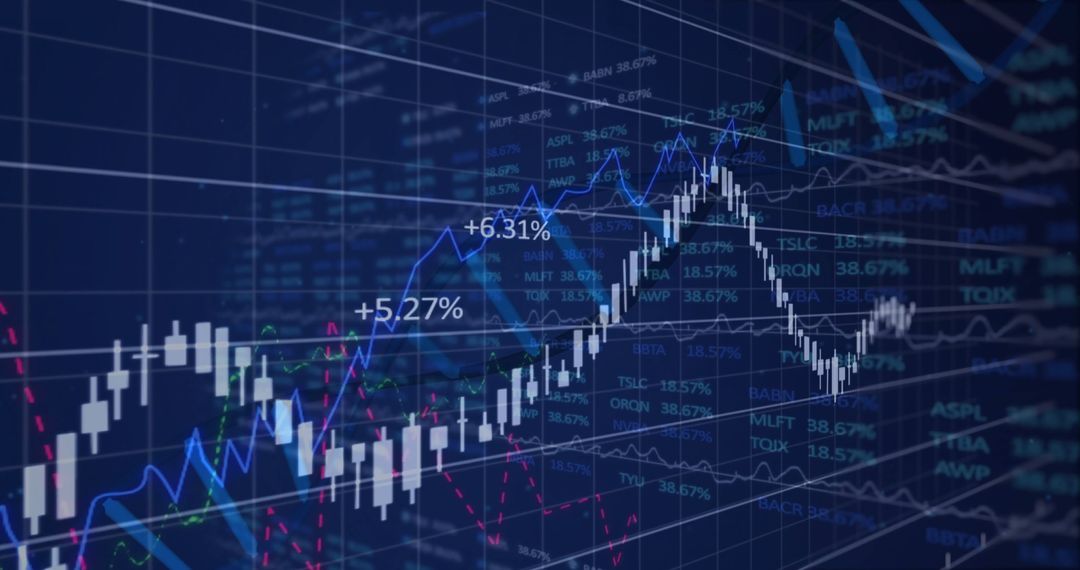
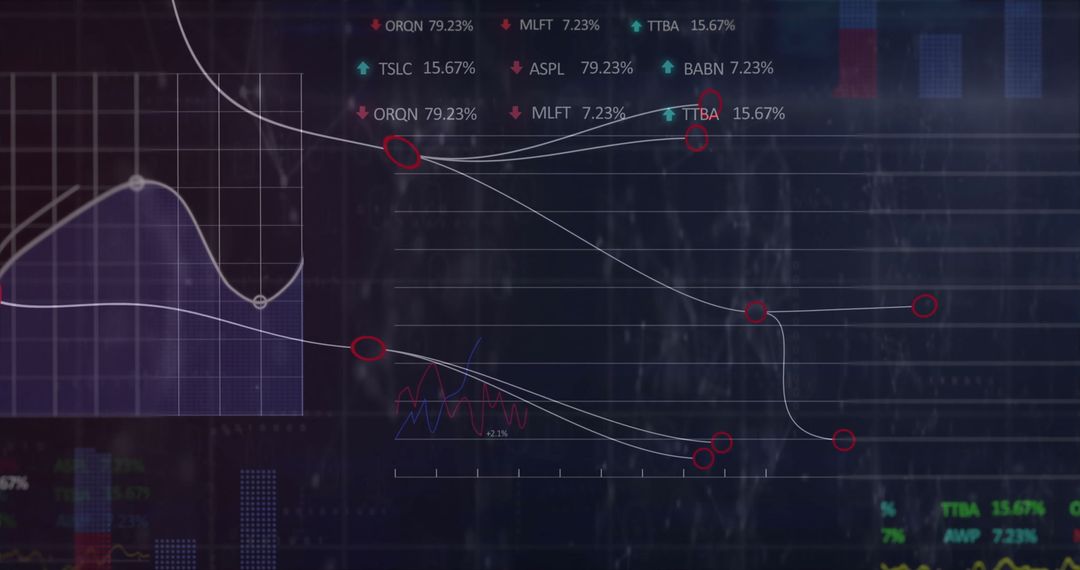
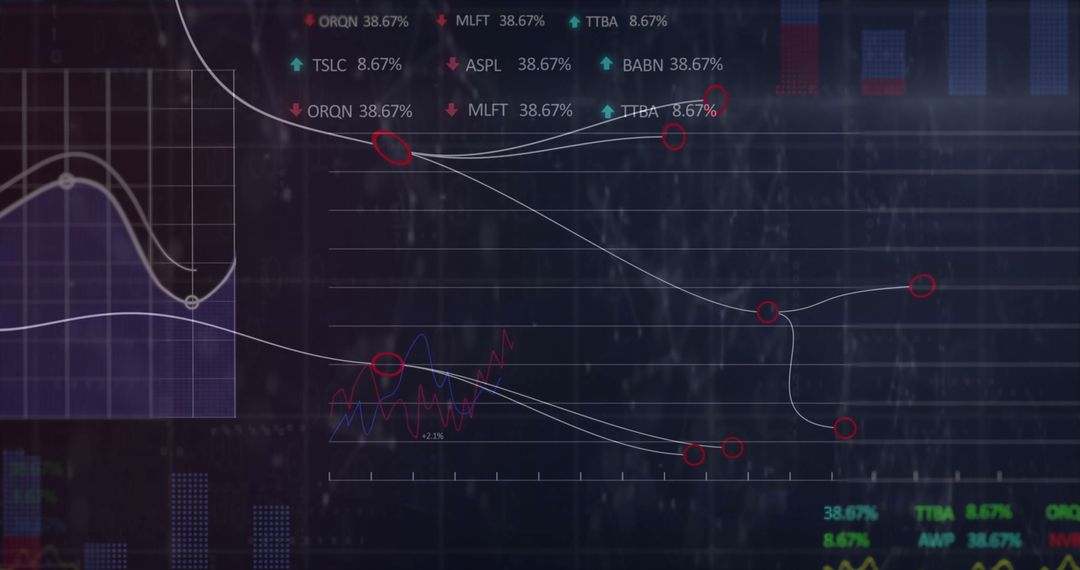
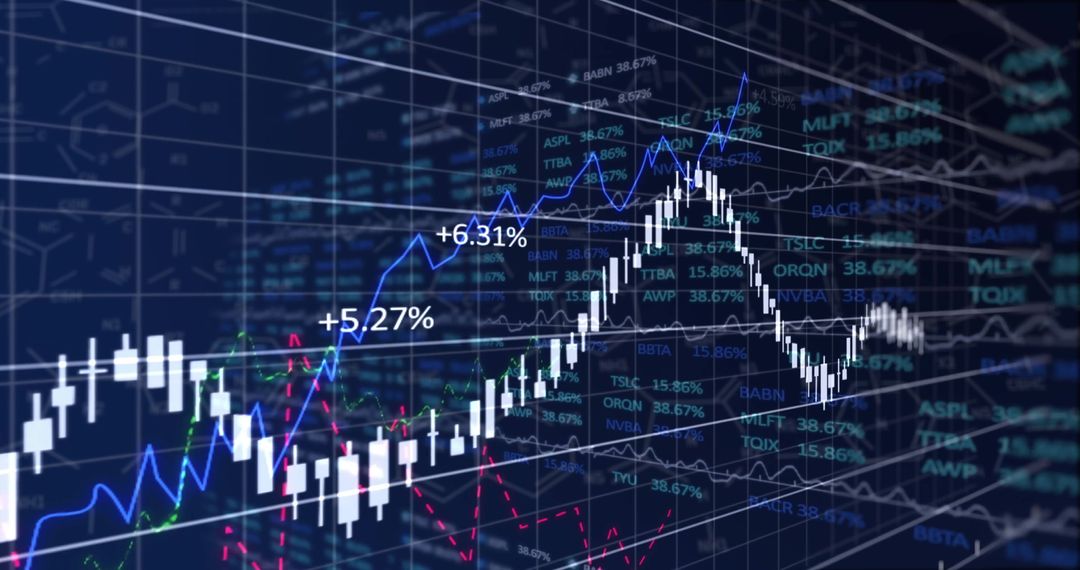
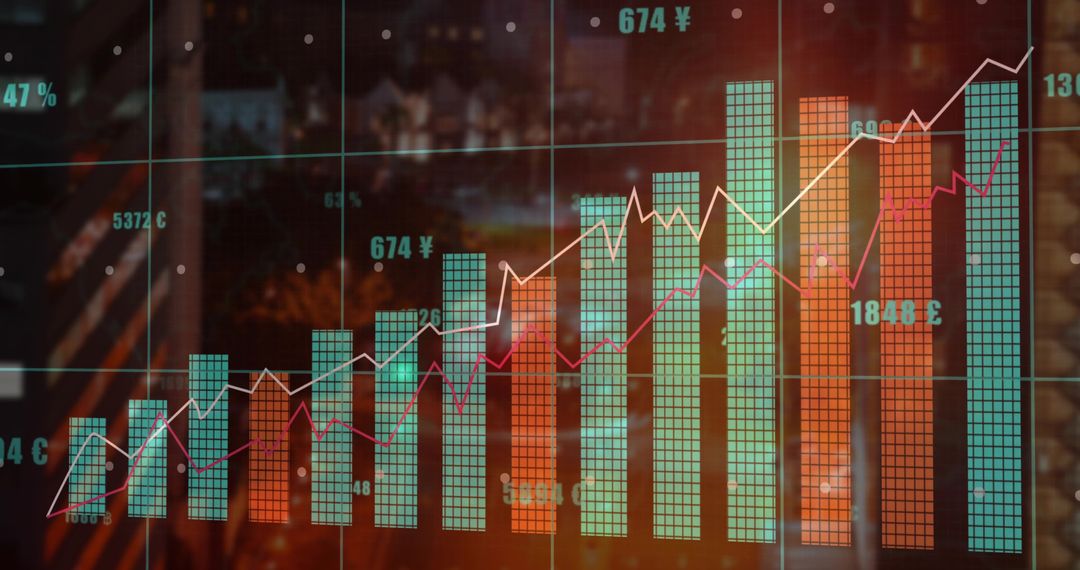
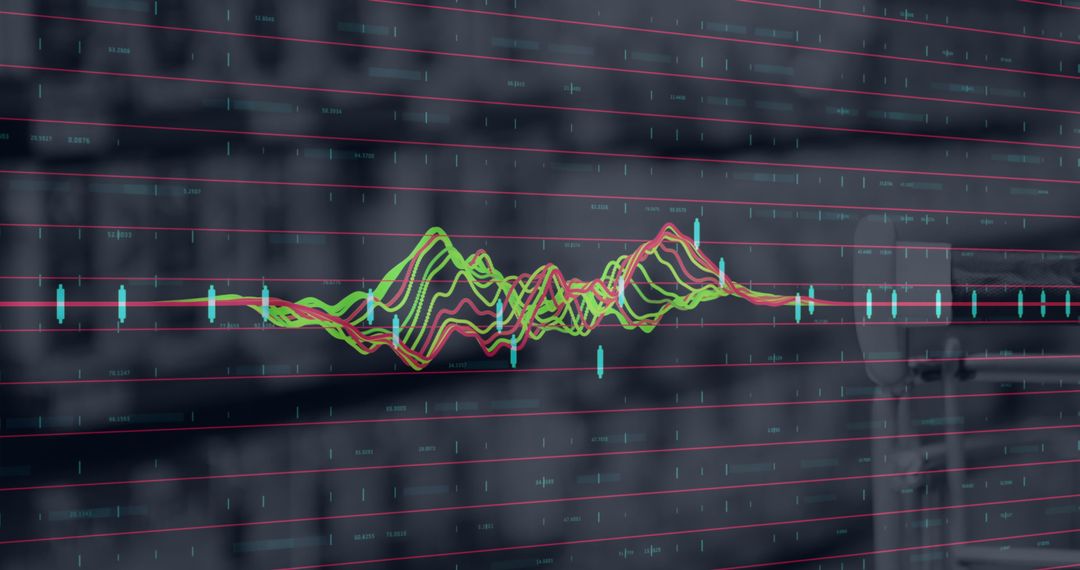
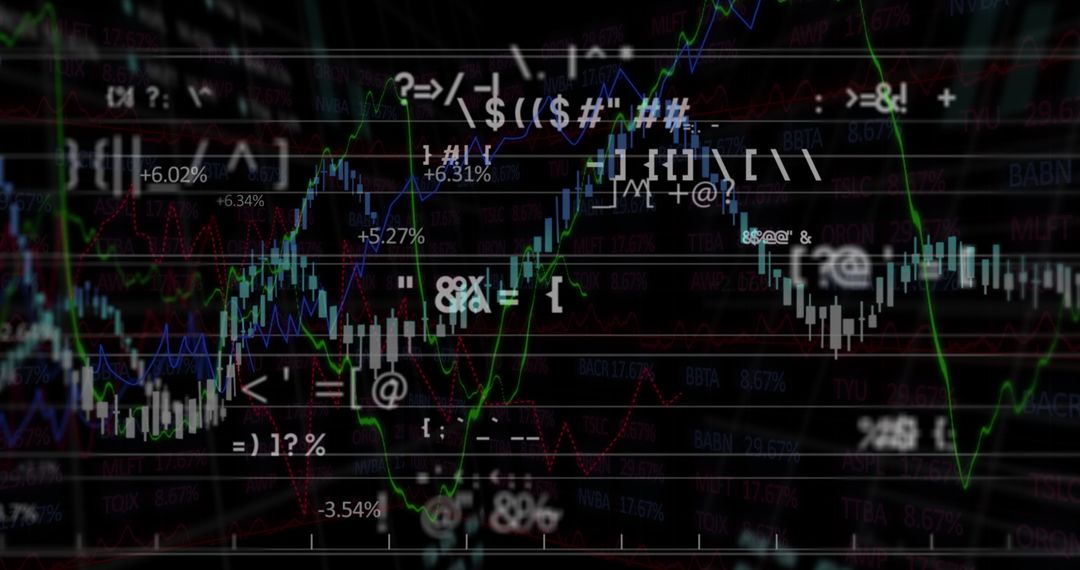
This representation shows a dynamic blend of candlestick bars with overlaid red and white trend lines. The presence of coding text suggests a connection to systematic financial analysis, while the rotating globe icon signifies the global nature of economic data analysis. Useful for illustrating financial reports, data-driven presentations, global market trends, coding-related financial contexts, or economic website design.
Powered by  - Get 15% off with code: PIKWIZARD15


0
downloads
downloads
Tags:
More
Credit Photo
If you would like to credit the Photo, here are some ways you can do so
Text Link
photo Link
<span class="text-link">
<span>
<a target="_blank" href=https://pikwizard.com/photo/digital-analytics-dashboard-with-candlestick-chart-and-globe-icon/9890ffec8f6add6921dabd8f64c1c34d/>PikWizard</a>
</span>
</span>
<span class="image-link">
<span
style="margin: 0 0 20px 0; display: inline-block; vertical-align: middle; width: 100%;"
>
<a
target="_blank"
href="https://pikwizard.com/photo/digital-analytics-dashboard-with-candlestick-chart-and-globe-icon/9890ffec8f6add6921dabd8f64c1c34d/"
style="text-decoration: none; font-size: 10px; margin: 0;"
>
<img src="https://pikwizard.com/pw/medium/9890ffec8f6add6921dabd8f64c1c34d.jpg" style="margin: 0; width: 100%;" alt="" />
<p style="font-size: 12px; margin: 0;">PikWizard</p>
</a>
</span>
</span>
Free (free of charge)
Free for personal and commercial use.
Author: Creative Art
Similar Free Stock Images
Premium


Premium


Premium


Premium


Premium


Premium


Premium


Premium


Premium


Premium


Premium


Premium


Premium


Premium


Premium


Premium


Premium


Premium


Premium


Premium


Premium


Premium


Premium

Premium

