
- Home >
- Stock Photos >
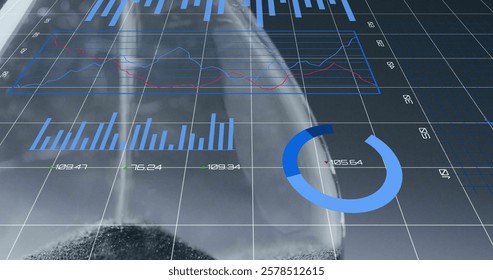
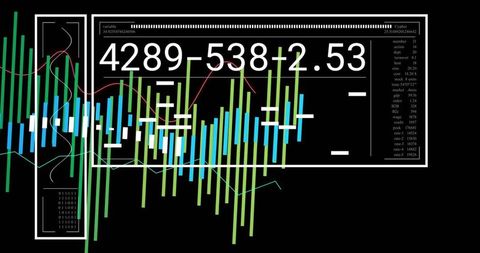
- Digital Analytics Dashboard with Code and Graphs Visualization
Digital Analytics Dashboard with Code and Graphs Visualization Image

Illustration combines Java programming code with colorful vertical bars, a red sine wave, and a cyan line representing data trends, creating an impression of a futuristic tech interface. Useful for website designs, blog posts related to technology, data analysis, software development, or content discussing innovations in data processing and digital transformation.
Powered by  - Get 15% off with code: PIKWIZARD15


downloads
Tags:
More
Credit Photo
If you would like to credit the Photo, here are some ways you can do so
Text Link
photo Link
<span class="text-link">
<span>
<a target="_blank" href=https://pikwizard.com/photo/digital-analytics-dashboard-with-code-and-graphs-visualization/66683d9369dd3af2f1204232adac560f/>PikWizard</a>
</span>
</span>
<span class="image-link">
<span
style="margin: 0 0 20px 0; display: inline-block; vertical-align: middle; width: 100%;"
>
<a
target="_blank"
href="https://pikwizard.com/photo/digital-analytics-dashboard-with-code-and-graphs-visualization/66683d9369dd3af2f1204232adac560f/"
style="text-decoration: none; font-size: 10px; margin: 0;"
>
<img src="https://pikwizard.com/pw/medium/66683d9369dd3af2f1204232adac560f.jpg" style="margin: 0; width: 100%;" alt="" />
<p style="font-size: 12px; margin: 0;">PikWizard</p>
</a>
</span>
</span>
Free (free of charge)
Free for personal and commercial use.
Author: Authentic Images
Similar Free Stock Images

Premium


Premium


Premium


Premium


Premium


Premium


Premium


Premium


Premium


Premium


Premium


Premium


Premium


Premium


Premium


Premium


Premium

Premium


Premium


Premium

Premium


Premium


Premium


Premium


Premium


Explore More Free Stock Images