- Home >
- Stock Photos >
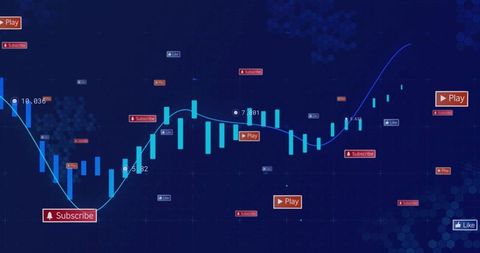
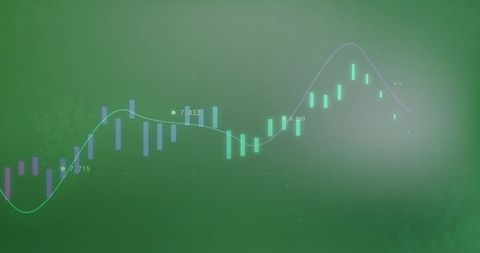
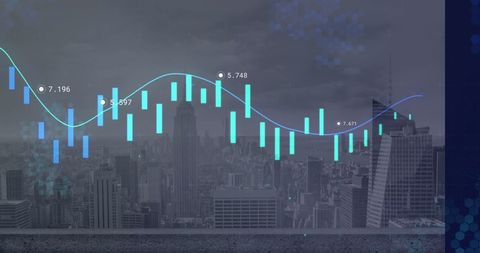
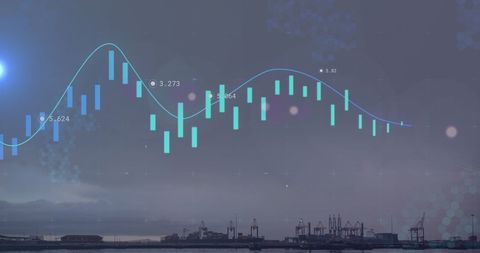
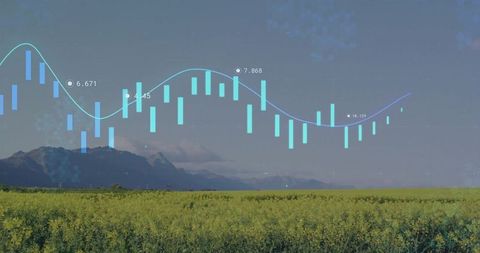
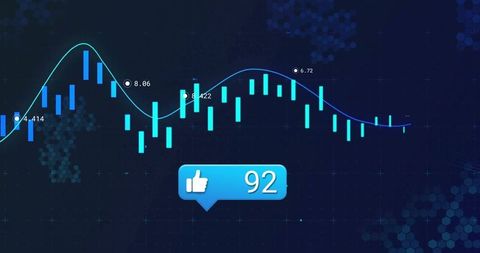
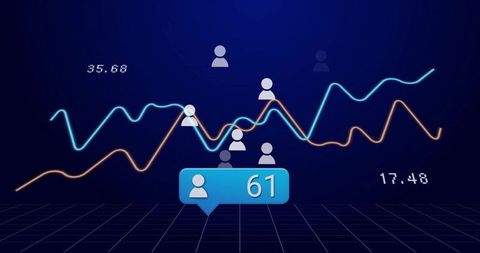
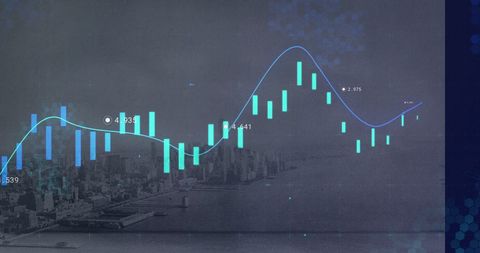
- Digital Analytics Dashboard with Data Visualization Trends
Digital Analytics Dashboard with Data Visualization Trends Image

This illustration showcases a sophisticated digital analytics dashboard, featuring dynamic data visualization with glowing bars and a weaving line graph. The accurate depiction of numeric markers highlights key points in the analysis process. Useful for presentations on big data, technology development, financial analysis tools, educational resources on analytics, or systems IT demonstrations meant to convey complex concepts in an accessible format.

downloads
Tags:
More
Credit Photo
If you would like to credit the Photo, here are some ways you can do so
Text Link
photo Link
<span class="text-link">
<span>
<a target="_blank" href=https://pikwizard.com/photo/digital-analytics-dashboard-with-data-visualization-trends/1ab37bc5070e81efad965a4e203006da/>PikWizard</a>
</span>
</span>
<span class="image-link">
<span
style="margin: 0 0 20px 0; display: inline-block; vertical-align: middle; width: 100%;"
>
<a
target="_blank"
href="https://pikwizard.com/photo/digital-analytics-dashboard-with-data-visualization-trends/1ab37bc5070e81efad965a4e203006da/"
style="text-decoration: none; font-size: 10px; margin: 0;"
>
<img src="https://pikwizard.com/pw/medium/1ab37bc5070e81efad965a4e203006da.jpg" style="margin: 0; width: 100%;" alt="" />
<p style="font-size: 12px; margin: 0;">PikWizard</p>
</a>
</span>
</span>
Free (free of charge)
Free for personal and commercial use.
Author: Creative Art