
- Home >
- Stock Photos >
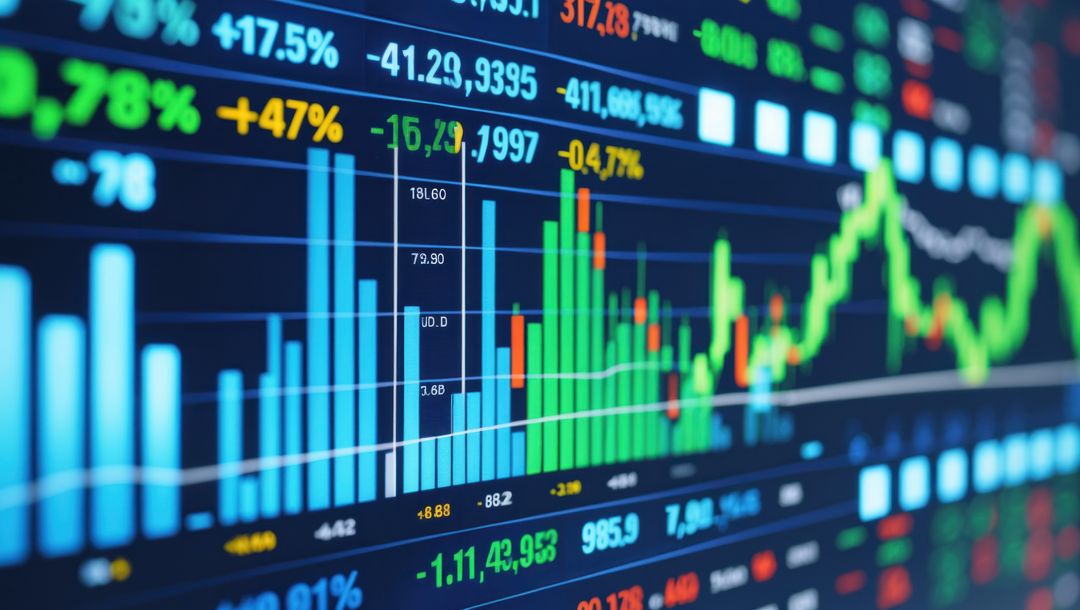
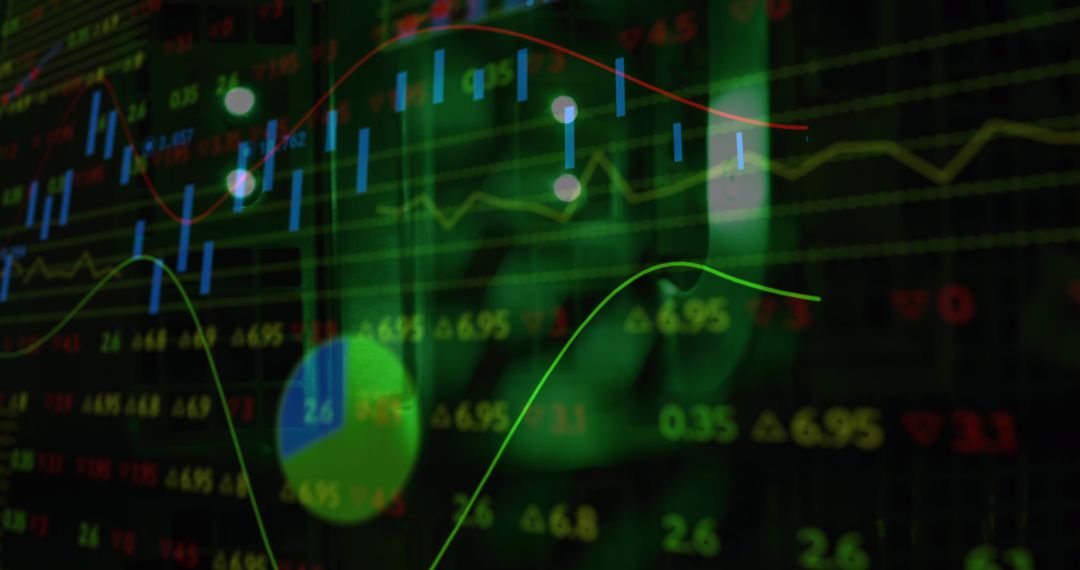
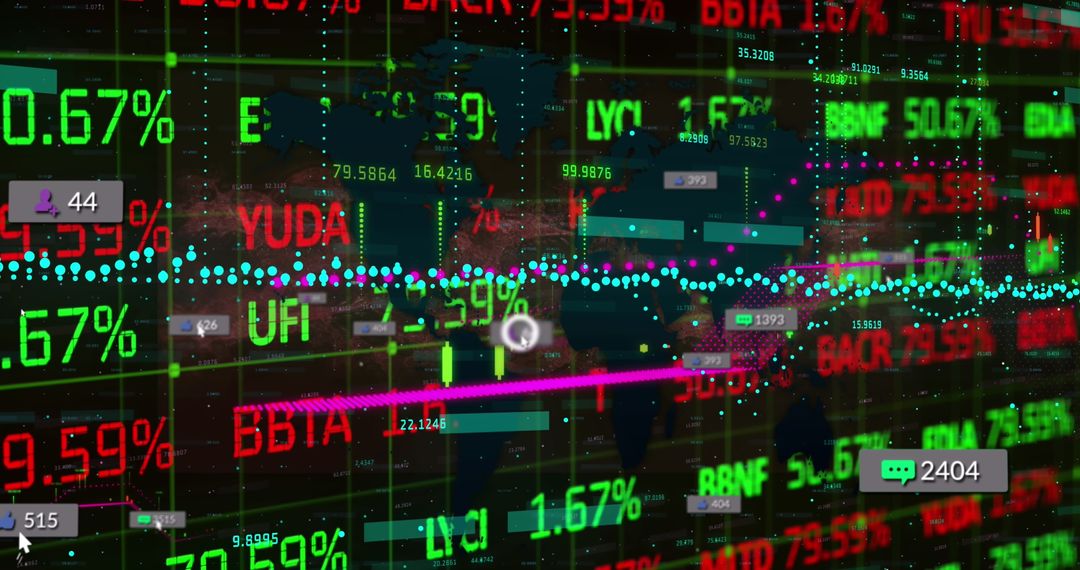
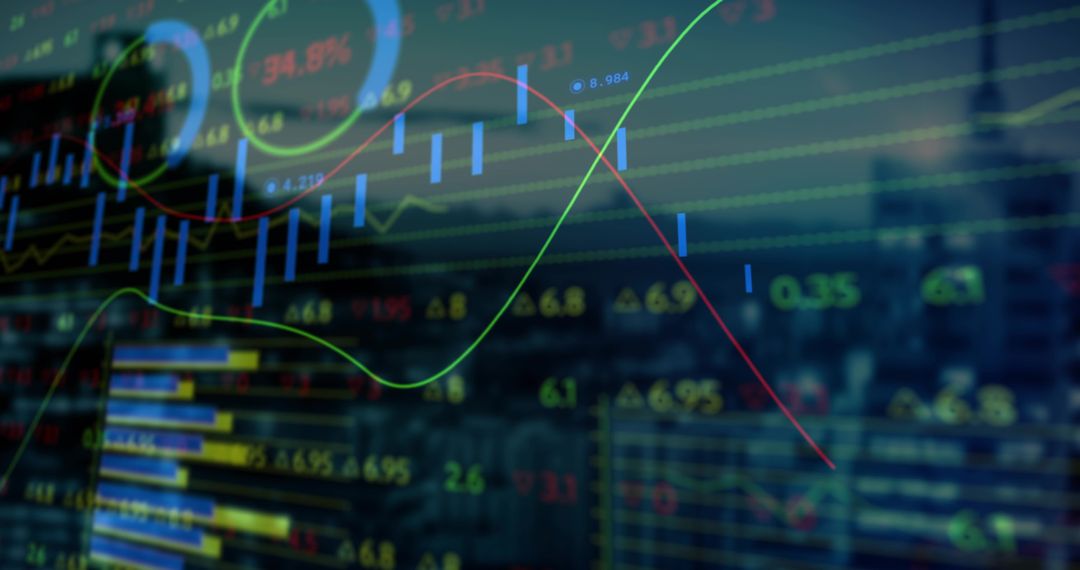
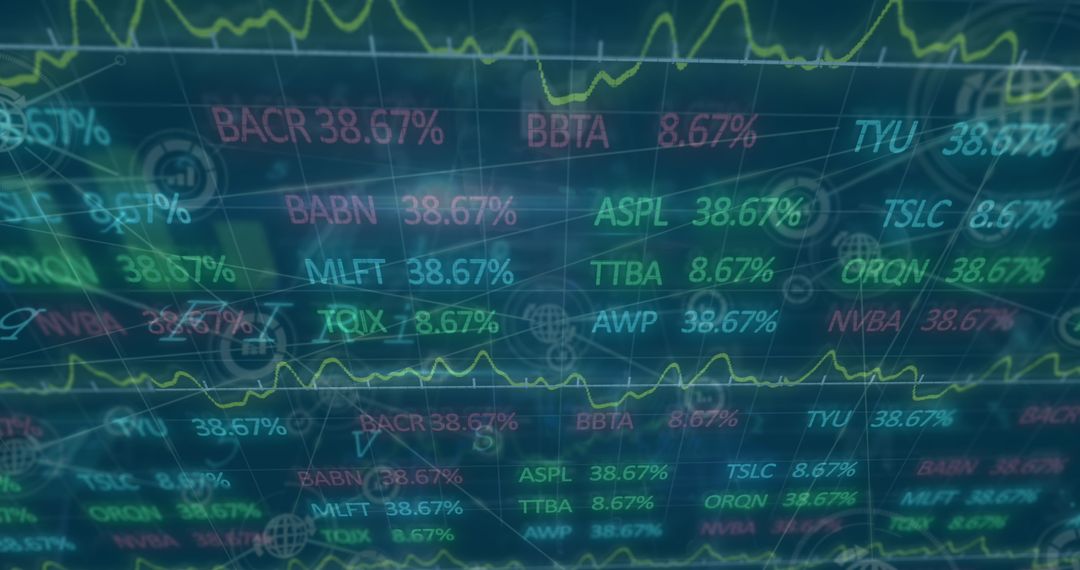
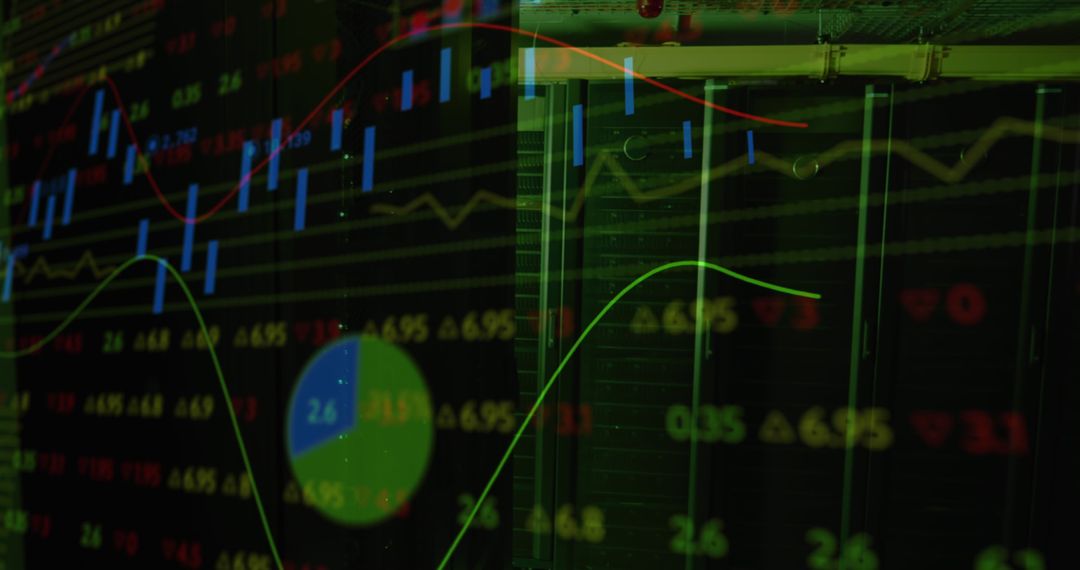
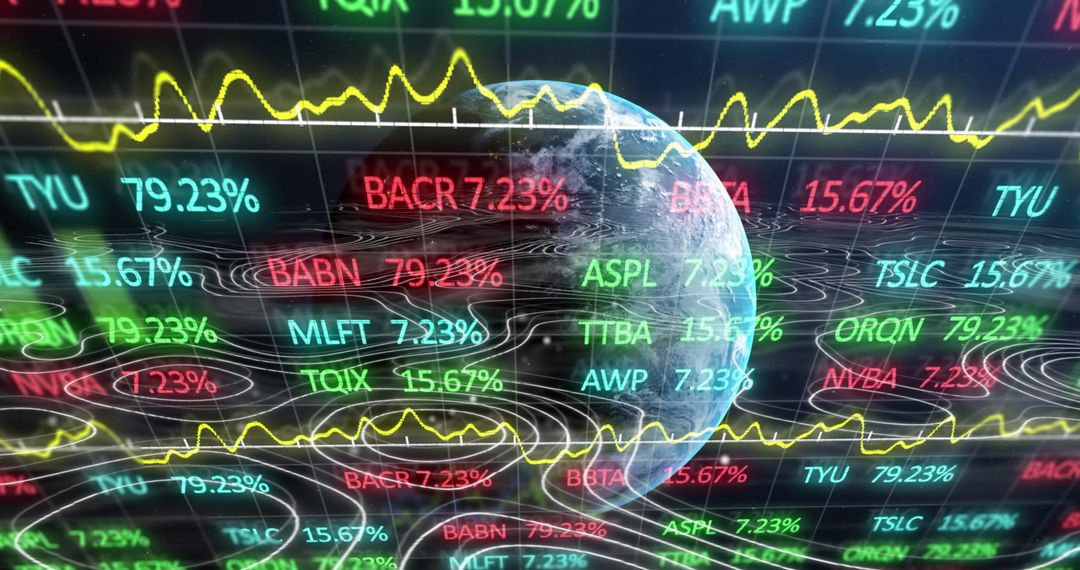
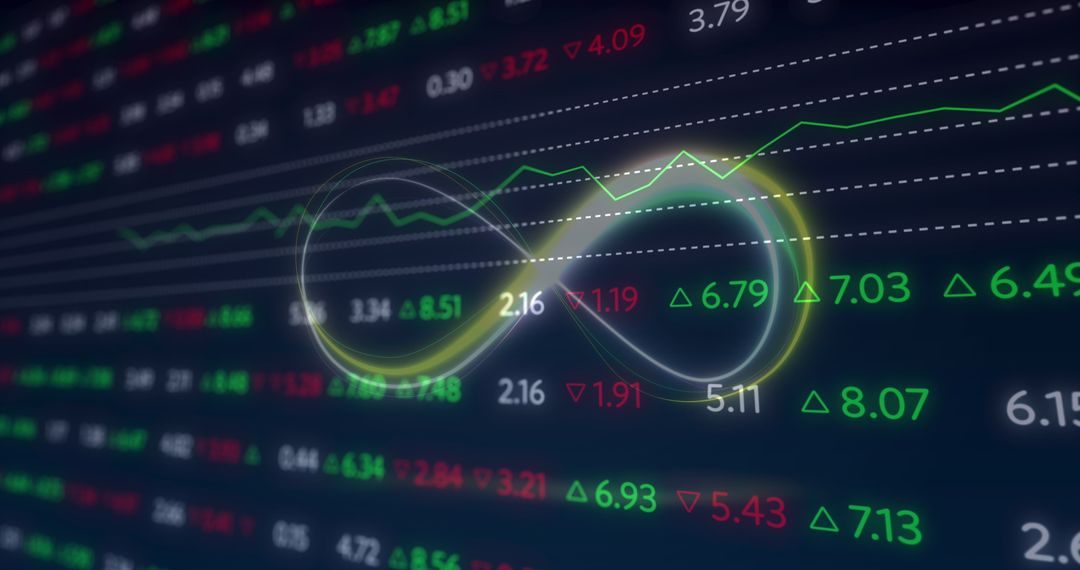
- Digital Analytics Dashboard with Financial Chart Indicators and Social Media Icons
Digital Analytics Dashboard with Financial Chart Indicators and Social Media Icons Image
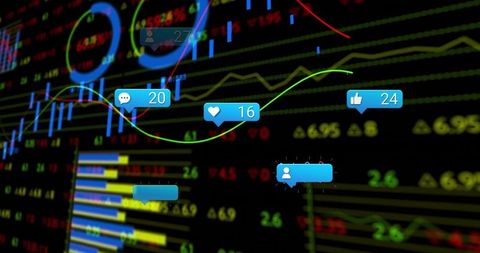
Comprehensive representation of a digital analytics dashboard combining financial charts with social media interactions. Perfect for illustrating concepts related to finance, investment, data analysis, mutual funds, and the integration of social media influence and digital technology in market-driven analysis. Useful for presentations, educational resources, or articles discussing modern financial tools.
Powered by  - Get 15% off with code: PIKWIZARD15


0
downloads
downloads
Tags:
More
Credit Photo
If you would like to credit the Photo, here are some ways you can do so
Text Link
photo Link
<span class="text-link">
<span>
<a target="_blank" href=https://pikwizard.com/photo/digital-analytics-dashboard-with-financial-chart-indicators-and-social-media-icons/bf794f618b1b60b5e20048025d72dd97/>PikWizard</a>
</span>
</span>
<span class="image-link">
<span
style="margin: 0 0 20px 0; display: inline-block; vertical-align: middle; width: 100%;"
>
<a
target="_blank"
href="https://pikwizard.com/photo/digital-analytics-dashboard-with-financial-chart-indicators-and-social-media-icons/bf794f618b1b60b5e20048025d72dd97/"
style="text-decoration: none; font-size: 10px; margin: 0;"
>
<img src="https://pikwizard.com/pw/medium/bf794f618b1b60b5e20048025d72dd97.jpg" style="margin: 0; width: 100%;" alt="" />
<p style="font-size: 12px; margin: 0;">PikWizard</p>
</a>
</span>
</span>
Free (free of charge)
Free for personal and commercial use.
Author: Awesome Content
Similar Free Stock Images
Premium


Premium


Premium


Premium


Premium


Premium


Premium


Premium


Premium


Premium


Premium


Premium


Premium


Premium


Premium


Premium


Premium


Premium


Premium


Premium


Premium


Premium

Premium


Premium

