
- Home >
- Stock Photos >
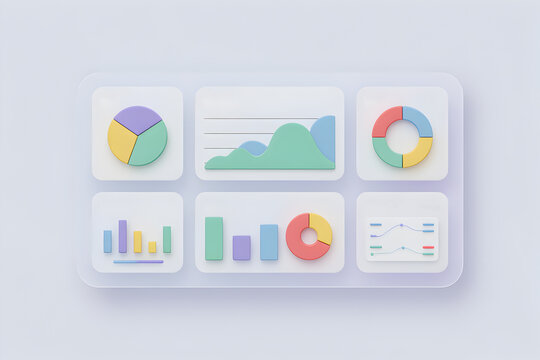
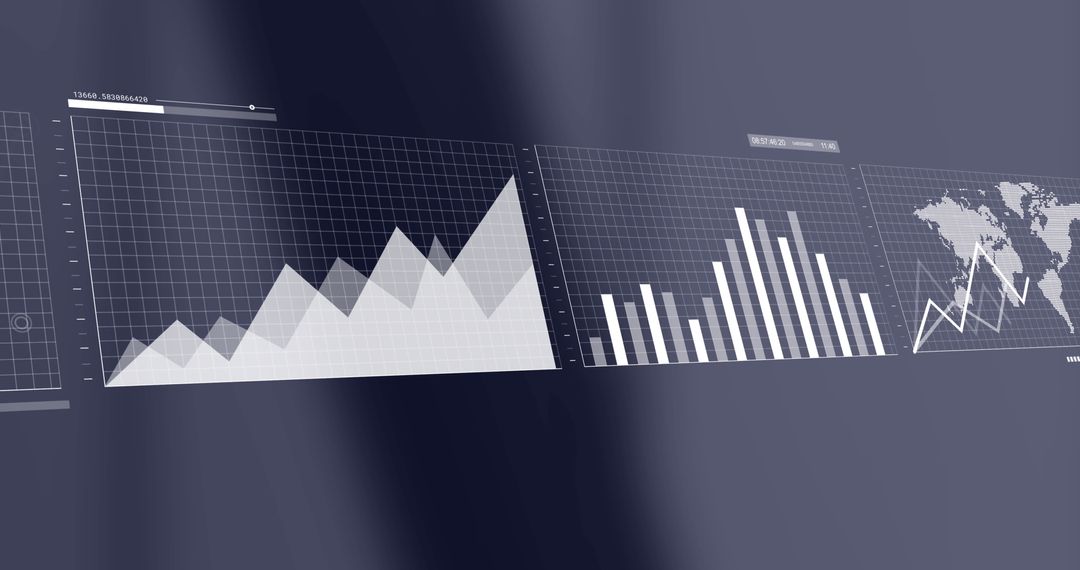
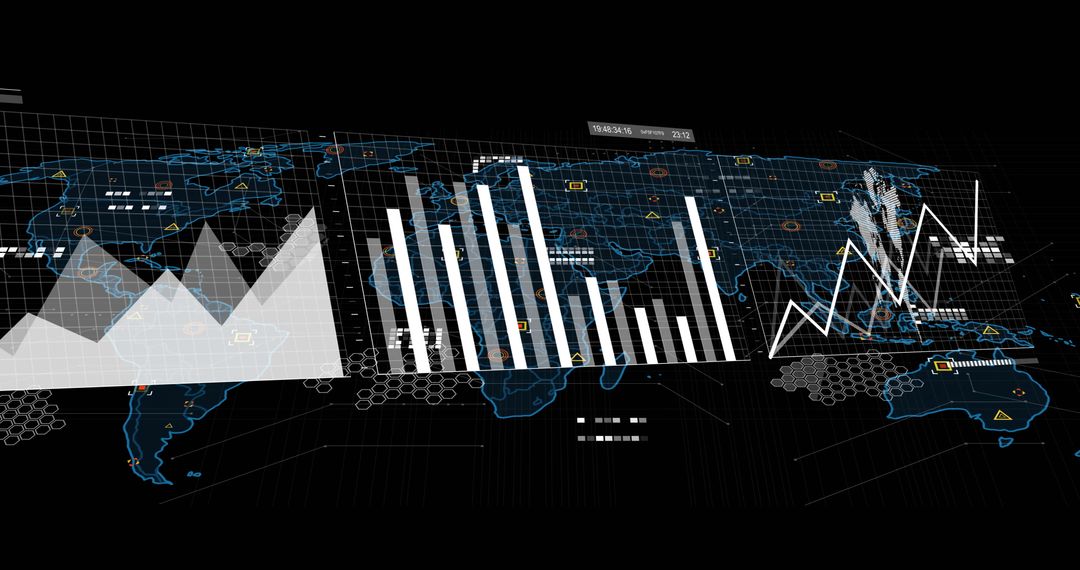
- Digital Analytics Dashboard with Global Health Data Visualization
Digital Analytics Dashboard with Global Health Data Visualization Image

This illustration shows an advanced digital analytics dashboard with dynamic charts including an area chart, bar chart, and line chart on a world map. Ideal for content related to modern technology, data-driven health analysis, digital forecasting, or global health insights. Perfect for using in presentations, articles, or blogs that discuss analytics, data visualization tools, and health statistics.
Powered by 


0
downloads
downloads
Tags:
More
Credit Photo
If you would like to credit the Photo, here are some ways you can do so
Text Link
photo Link
<span class="text-link">
<span>
<a target="_blank" href=https://pikwizard.com/photo/digital-analytics-dashboard-with-global-health-data-visualization/13e158db478202104c7a83e24225b31f/>PikWizard</a>
</span>
</span>
<span class="image-link">
<span
style="margin: 0 0 20px 0; display: inline-block; vertical-align: middle; width: 100%;"
>
<a
target="_blank"
href="https://pikwizard.com/photo/digital-analytics-dashboard-with-global-health-data-visualization/13e158db478202104c7a83e24225b31f/"
style="text-decoration: none; font-size: 10px; margin: 0;"
>
<img src="https://pikwizard.com/pw/medium/13e158db478202104c7a83e24225b31f.jpg" style="margin: 0; width: 100%;" alt="" />
<p style="font-size: 12px; margin: 0;">PikWizard</p>
</a>
</span>
</span>
Free (free of charge)
Free for personal and commercial use.
Author: Awesome Content
Similar Free Stock Images

Premium


Premium


Premium


Premium


Premium


Premium


Premium


Premium


Premium


Premium


Premium


Premium


Premium


Premium


Premium


Premium


Premium


Premium


Premium


Premium


Premium


Premium


Premium


Premium

