- Home >
- Stock Photos >
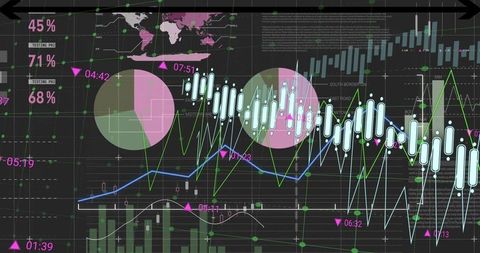
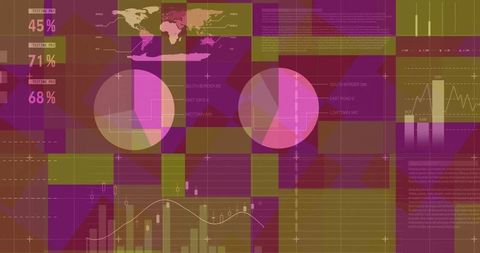
- Digital Analytics Dashboard with Global Metrics and Visualizations
Digital Analytics Dashboard with Global Metrics and Visualizations Image

The dashboard displays global data analytics including pie charts, trend lines, and a world map with transparent overlays. Useful for presentations on business intelligence, volumetric analysis, tech strategies, and detailed data interpretation.

downloads
Tags:
More
Credit Photo
If you would like to credit the Photo, here are some ways you can do so
Text Link
photo Link
<span class="text-link">
<span>
<a target="_blank" href=https://pikwizard.com/photo/digital-analytics-dashboard-with-global-metrics-and-visualizations/87f76c7071d83fbf1f1e3662c8833974/>PikWizard</a>
</span>
</span>
<span class="image-link">
<span
style="margin: 0 0 20px 0; display: inline-block; vertical-align: middle; width: 100%;"
>
<a
target="_blank"
href="https://pikwizard.com/photo/digital-analytics-dashboard-with-global-metrics-and-visualizations/87f76c7071d83fbf1f1e3662c8833974/"
style="text-decoration: none; font-size: 10px; margin: 0;"
>
<img src="https://pikwizard.com/pw/medium/87f76c7071d83fbf1f1e3662c8833974.jpg" style="margin: 0; width: 100%;" alt="" />
<p style="font-size: 12px; margin: 0;">PikWizard</p>
</a>
</span>
</span>
Free (free of charge)
Free for personal and commercial use.
Author: Awesome Content