
- Home >
- Stock Photos >
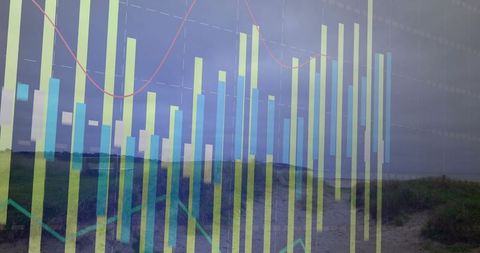
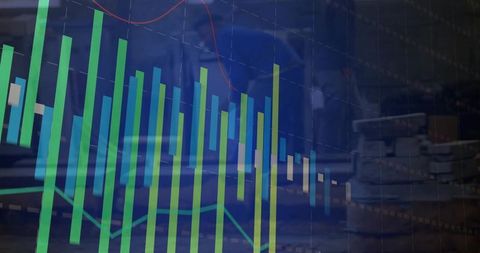
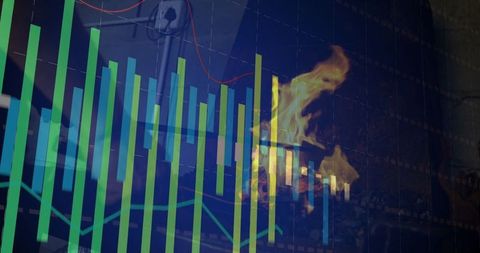
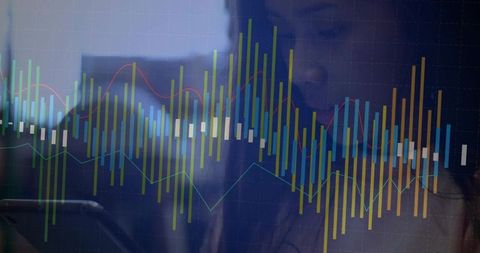
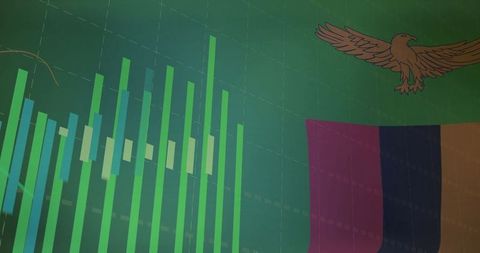
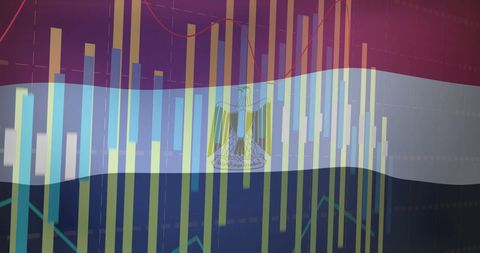
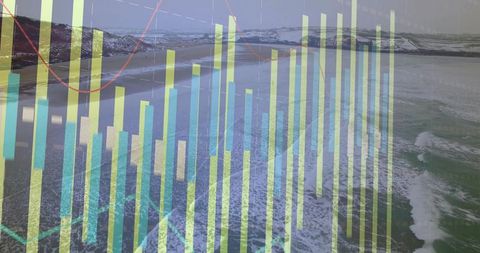
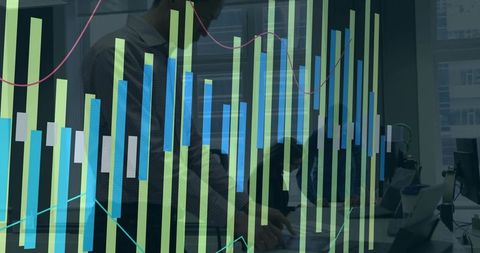
- Digital Analytics Dashboard with Indicators and Data Trends
Digital Analytics Dashboard with Indicators and Data Trends Image
Colorful bar chart featuring water and CO icons illustrates fluctuating data trends on a digital analytics dashboard. Useful for presentations on efficiency management, real-time data analysis, and technological metrics. Highlights modern approaches in data monitoring.
Powered by  - Get 15% off with code: PIKWIZARD15


downloads
Tags:
More
Credit Photo
If you would like to credit the Photo, here are some ways you can do so
Text Link
photo Link
<span class="text-link">
<span>
<a target="_blank" href=https://pikwizard.com/photo/digital-analytics-dashboard-with-indicators-and-data-trends/fe732b0ef31ee560dcea1304cad40663/>PikWizard</a>
</span>
</span>
<span class="image-link">
<span
style="margin: 0 0 20px 0; display: inline-block; vertical-align: middle; width: 100%;"
>
<a
target="_blank"
href="https://pikwizard.com/photo/digital-analytics-dashboard-with-indicators-and-data-trends/fe732b0ef31ee560dcea1304cad40663/"
style="text-decoration: none; font-size: 10px; margin: 0;"
>
<img src="https://pikwizard.com/pw/medium/fe732b0ef31ee560dcea1304cad40663.jpg" style="margin: 0; width: 100%;" alt="" />
<p style="font-size: 12px; margin: 0;">PikWizard</p>
</a>
</span>
</span>
Free (free of charge)
Free for personal and commercial use.
Author: Awesome Content
Similar Free Stock Images

Premium


Premium

Premium


Premium


Premium

Premium


Premium


Premium

Premium


Premium

Premium

Premium

Premium


Premium


Premium


Premium


Premium


Premium


Premium


Premium


Premium

Premium


Premium


Premium


Premium


Explore More Free Stock Images