
- Home >
- Stock Photos >
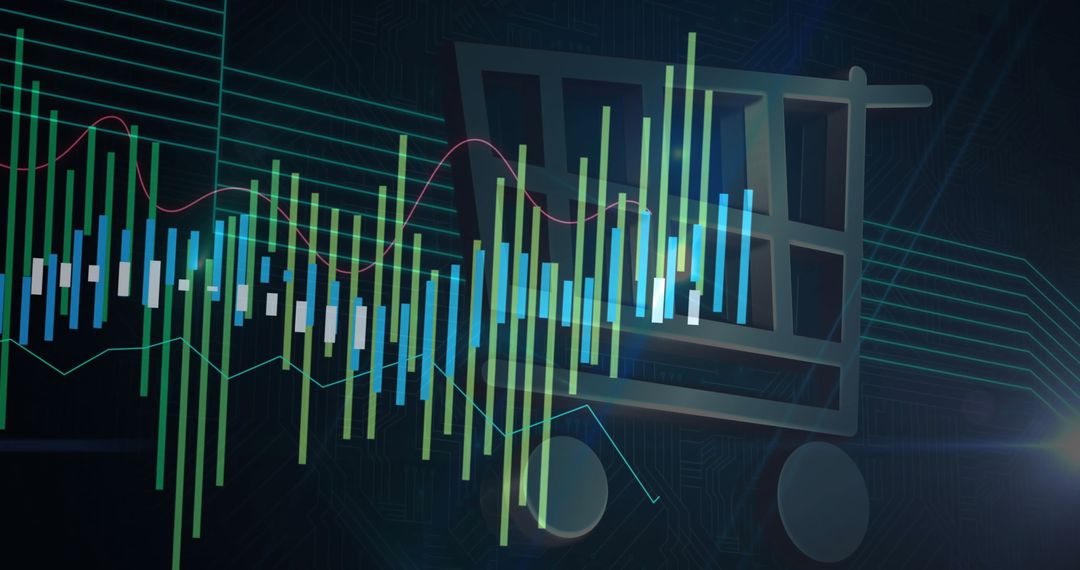
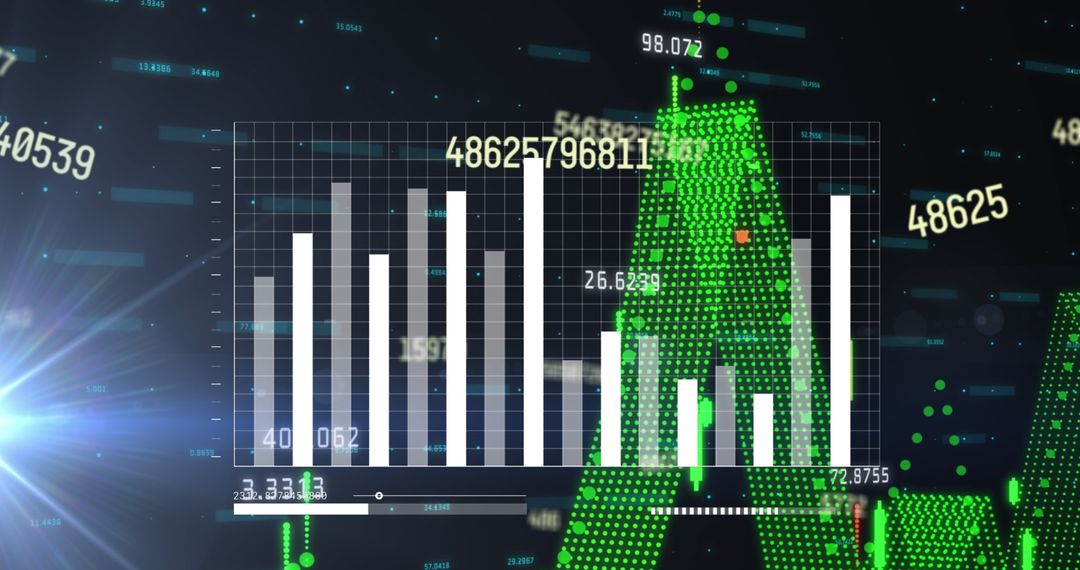
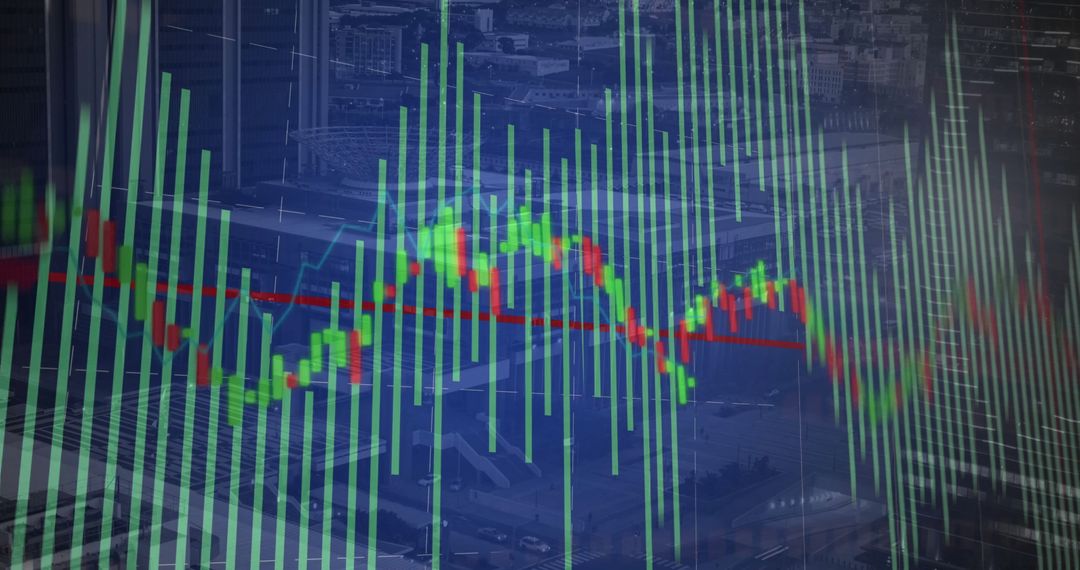
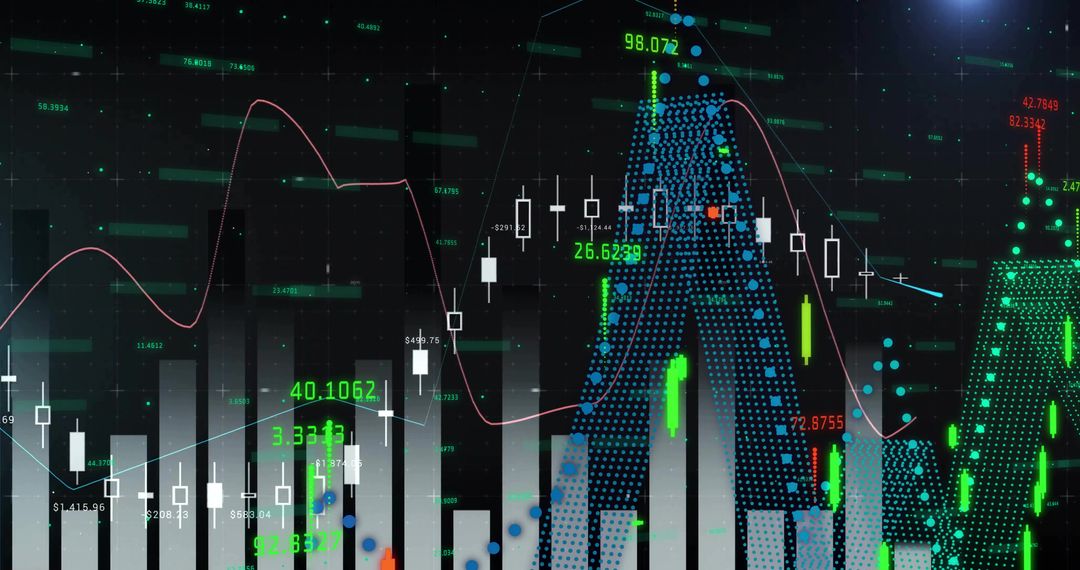
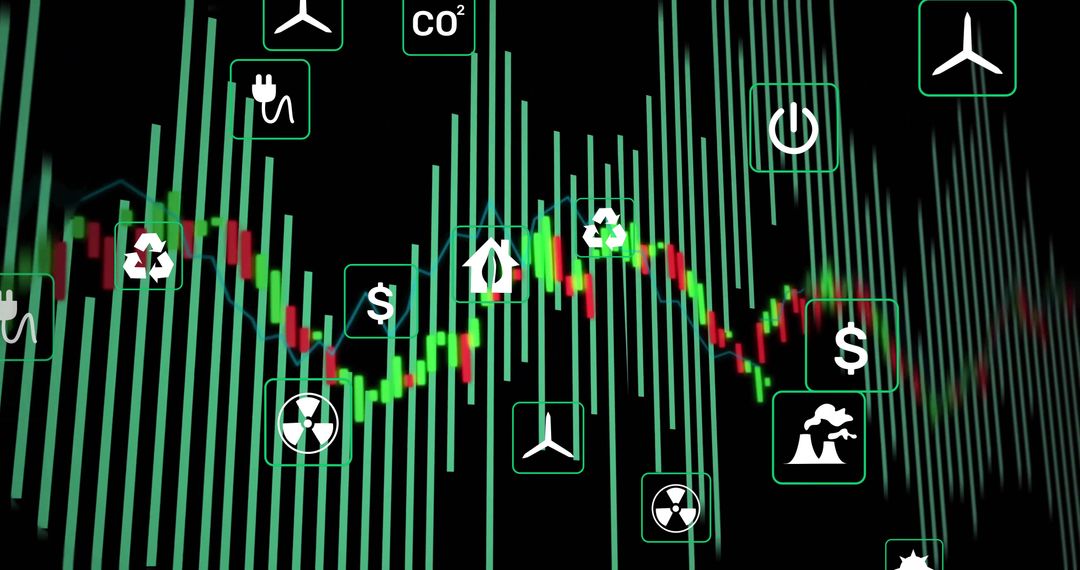
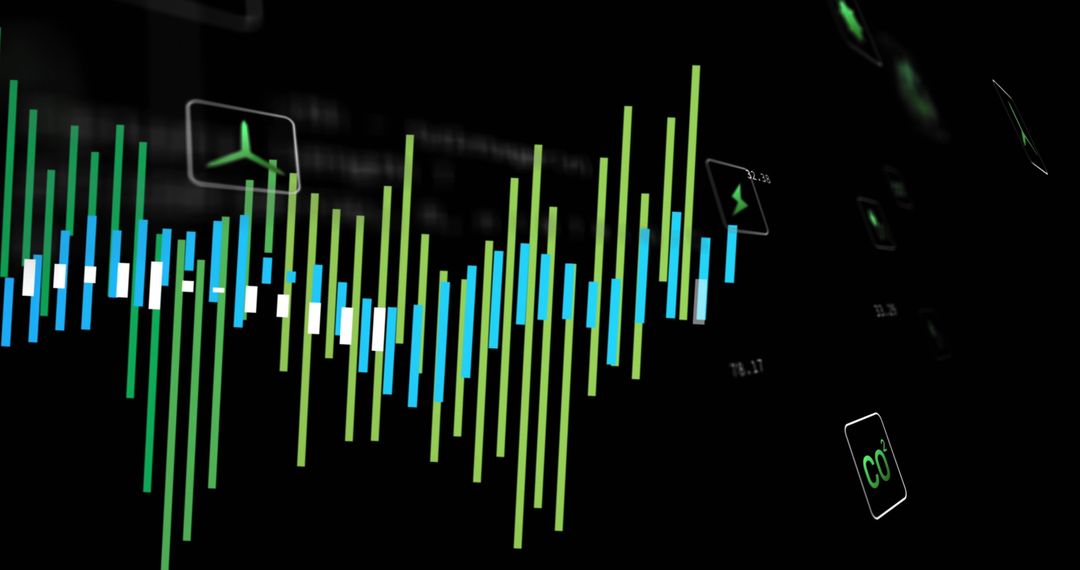
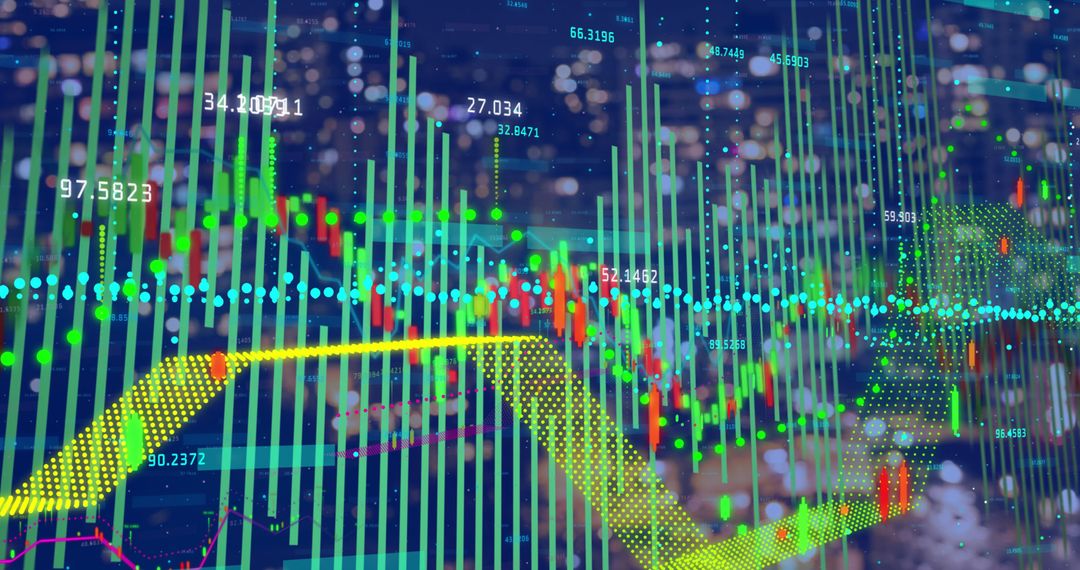
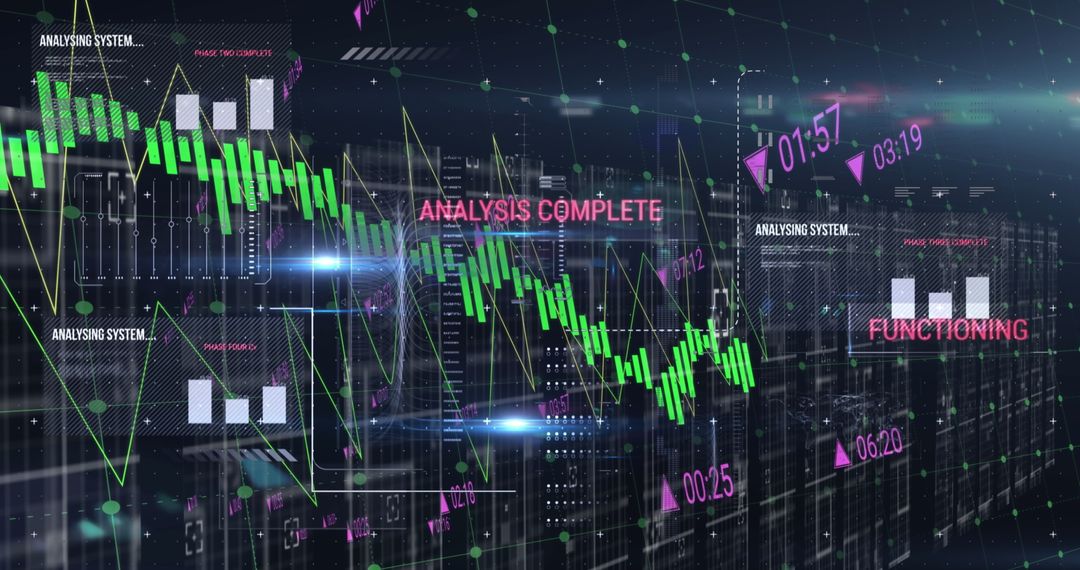
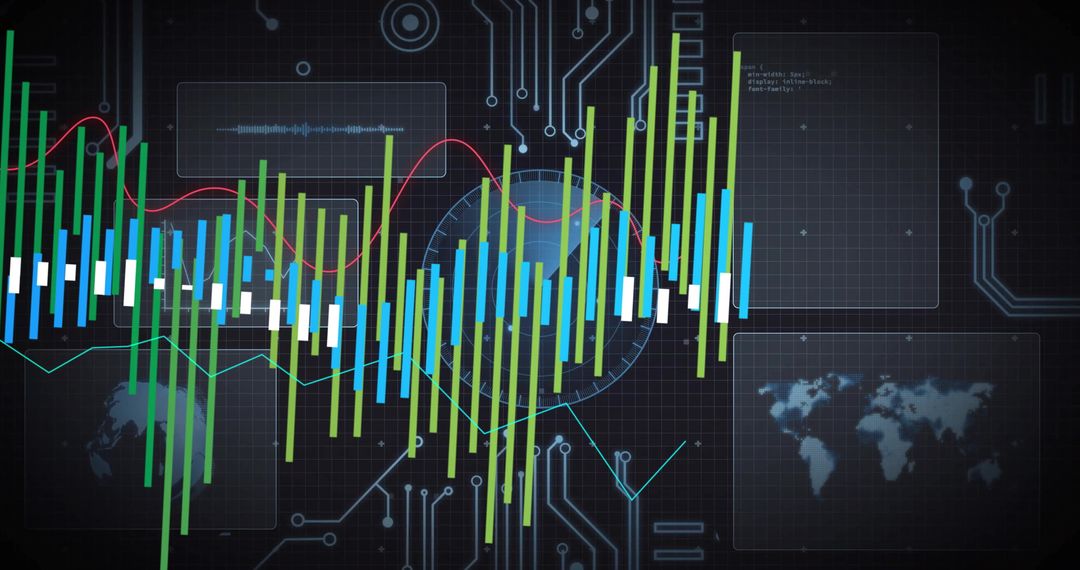
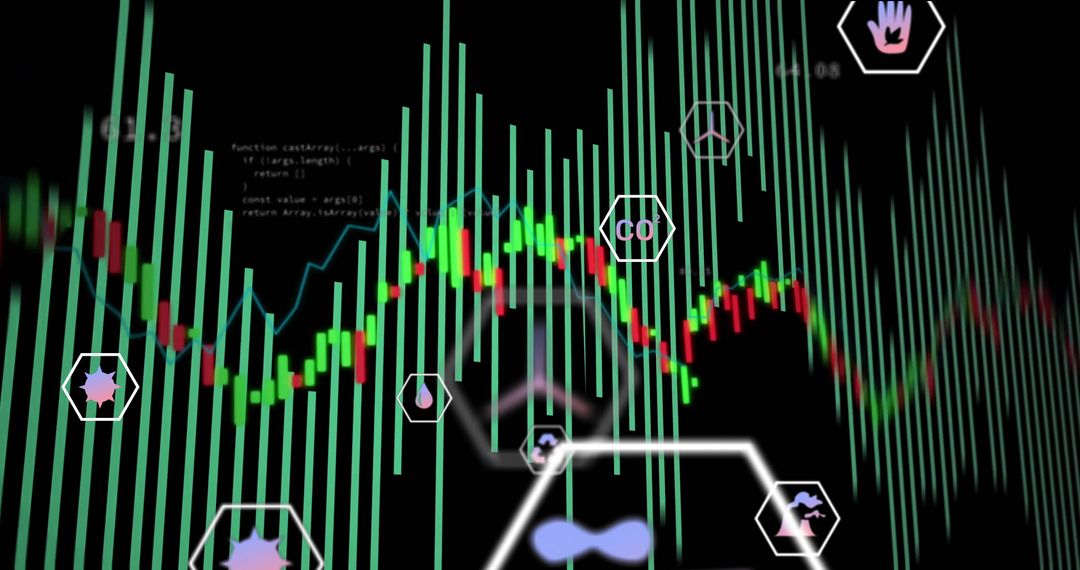
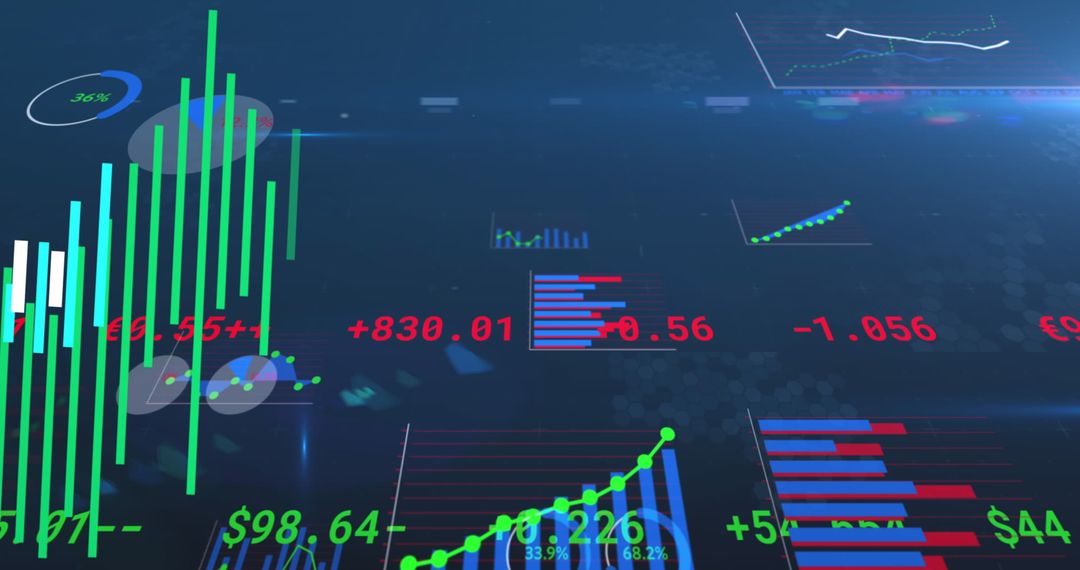
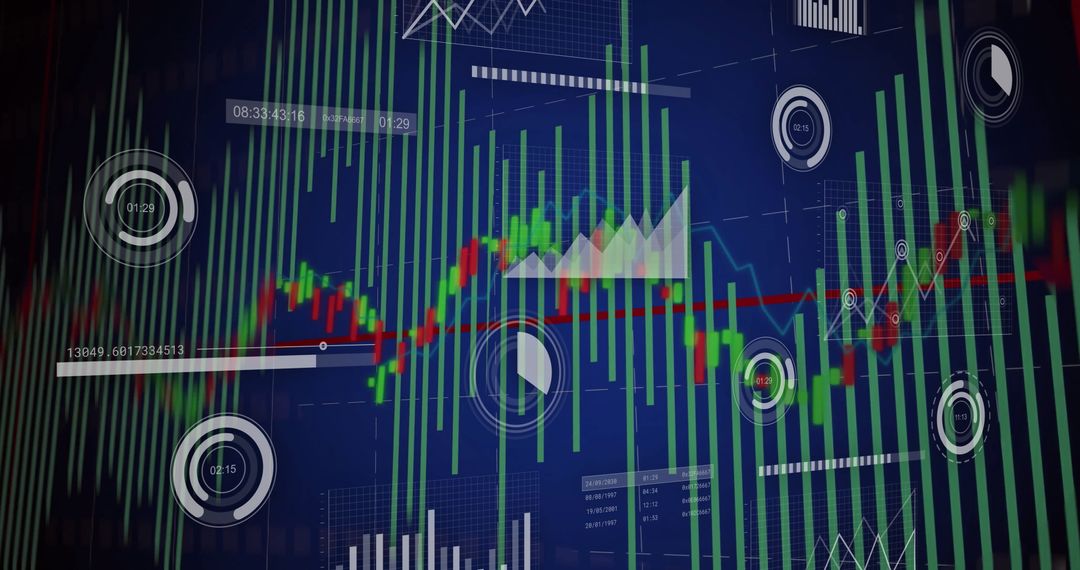
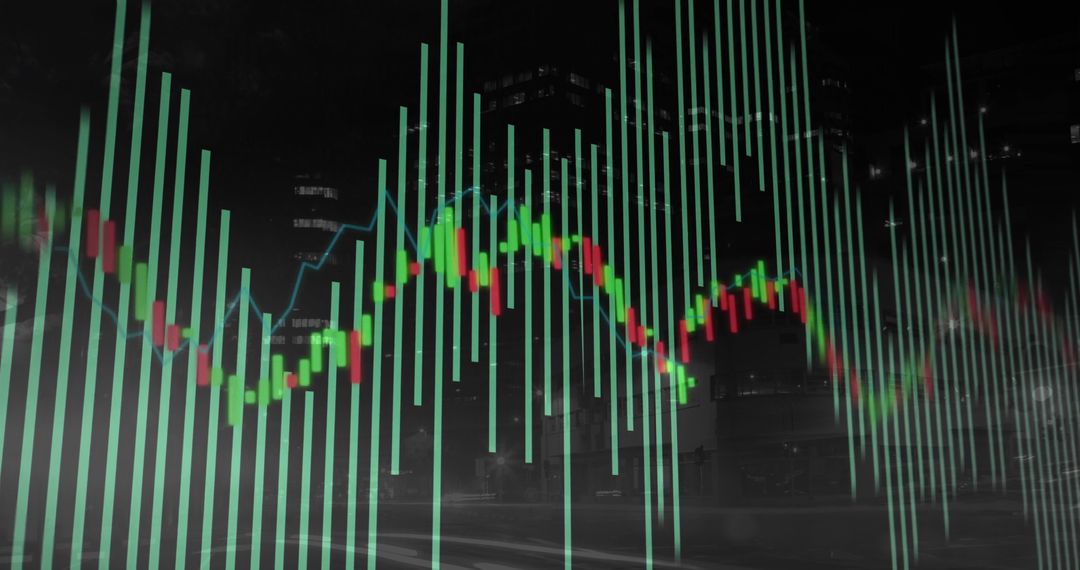
- Digital Analytics Dashboard with Infographic Charting Data Trends
Digital Analytics Dashboard with Infographic Charting Data Trends Image
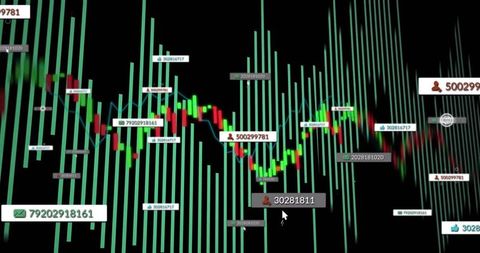
This detailed analytics dashboard showcases digital data trends with a blend of green bars and candlestick chart patterns overlaying rich numerical labels. It is ideal for professionals in finance, trading, and data analysis illustrating day-to-day variations in stock market or trading activities. Useful both in presentations projecting upcoming market trends and designing detailed financial report templates to visually adorn essential meetings and business contexts. Suitable for educational and technological environment-focused material primarily aimed at gaining deeper understanding of fluctuations in continuous market data.
Powered by 


0
downloads
downloads
Tags:
More
Credit Photo
If you would like to credit the Photo, here are some ways you can do so
Text Link
photo Link
<span class="text-link">
<span>
<a target="_blank" href=https://pikwizard.com/photo/digital-analytics-dashboard-with-infographic-charting-data-trends/6d523393561c8f84ba0578919770f653/>PikWizard</a>
</span>
</span>
<span class="image-link">
<span
style="margin: 0 0 20px 0; display: inline-block; vertical-align: middle; width: 100%;"
>
<a
target="_blank"
href="https://pikwizard.com/photo/digital-analytics-dashboard-with-infographic-charting-data-trends/6d523393561c8f84ba0578919770f653/"
style="text-decoration: none; font-size: 10px; margin: 0;"
>
<img src="https://pikwizard.com/pw/medium/6d523393561c8f84ba0578919770f653.jpg" style="margin: 0; width: 100%;" alt="" />
<p style="font-size: 12px; margin: 0;">PikWizard</p>
</a>
</span>
</span>
Free (free of charge)
Free for personal and commercial use.
Author: People Creations
Similar Free Stock Images

Premium


Premium


Premium


Premium


Premium


Premium


Premium


Premium


Premium


Premium


Premium


Premium


Premium


Premium


Premium


Premium


Premium

Premium


Premium


Premium


Premium


Premium


Premium


Premium

