
- Home >
- Stock Photos >
- Digital Analytics Dashboard with Interactive Charts and Data
Digital Analytics Dashboard with Interactive Charts and Data Image
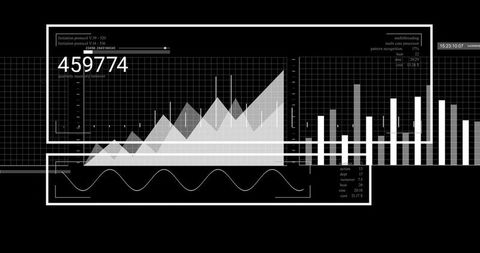
This image features a digital dashboard panel, ideal for showcasing data analysis and technology in modern business presentations. It includes interactive charts, a numerical counter, and timestamps. Useful for illustrating the concept of analytics in technology-themed brochures, website interface designs, or educational materials on data interpretation.
Powered by 


downloads
Tags:
More
Credit Photo
If you would like to credit the Photo, here are some ways you can do so
Text Link
photo Link
<span class="text-link">
<span>
<a target="_blank" href=https://pikwizard.com/photo/digital-analytics-dashboard-with-interactive-charts-and-data/bee6a2ae175c436bda39969cd24b5e84/>PikWizard</a>
</span>
</span>
<span class="image-link">
<span
style="margin: 0 0 20px 0; display: inline-block; vertical-align: middle; width: 100%;"
>
<a
target="_blank"
href="https://pikwizard.com/photo/digital-analytics-dashboard-with-interactive-charts-and-data/bee6a2ae175c436bda39969cd24b5e84/"
style="text-decoration: none; font-size: 10px; margin: 0;"
>
<img src="https://pikwizard.com/pw/medium/bee6a2ae175c436bda39969cd24b5e84.jpg" style="margin: 0; width: 100%;" alt="" />
<p style="font-size: 12px; margin: 0;">PikWizard</p>
</a>
</span>
</span>
Free (free of charge)
Free for personal and commercial use.
Author: Creative Art