- Home >
- Stock Photos >
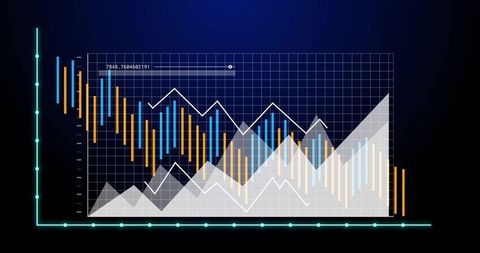
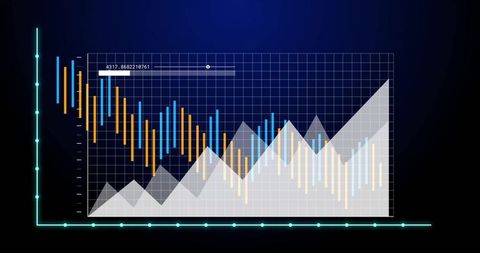
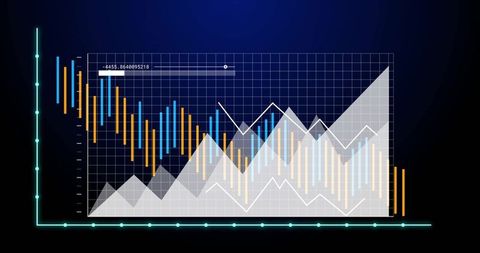
- Digital Analytics Dashboard with Interactive Data Visualization
Digital Analytics Dashboard with Interactive Data Visualization Image
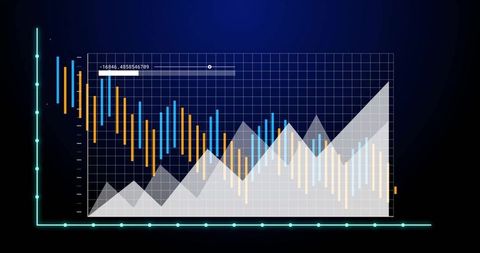
Dynamic data chart displaying overlays with orange and blue bars against a digital dashboard. The cyan axes provide a sleek, modern visualization, suitable for presentations, technology companies, educational purposes, or any project focused on data analysis and interpretation.

downloads
Tags:
More
Credit Photo
If you would like to credit the Photo, here are some ways you can do so
Text Link
photo Link
<span class="text-link">
<span>
<a target="_blank" href=https://pikwizard.com/photo/digital-analytics-dashboard-with-interactive-data-visualization/24c292a3a3b75f76aa28af68dc04ea2f/>PikWizard</a>
</span>
</span>
<span class="image-link">
<span
style="margin: 0 0 20px 0; display: inline-block; vertical-align: middle; width: 100%;"
>
<a
target="_blank"
href="https://pikwizard.com/photo/digital-analytics-dashboard-with-interactive-data-visualization/24c292a3a3b75f76aa28af68dc04ea2f/"
style="text-decoration: none; font-size: 10px; margin: 0;"
>
<img src="https://pikwizard.com/pw/medium/24c292a3a3b75f76aa28af68dc04ea2f.jpg" style="margin: 0; width: 100%;" alt="" />
<p style="font-size: 12px; margin: 0;">PikWizard</p>
</a>
</span>
</span>
Free (free of charge)
Free for personal and commercial use.
Author: Authentic Images