1. Home > 
  2. Stock Photos > 
  3. Digital Analytics Dashboard with Pinpoint Maps and Graphs

Digital Analytics Dashboard with Pinpoint Maps and Graphs Image

Digital Analytics Dashboard with Pinpoint Maps and Graphs

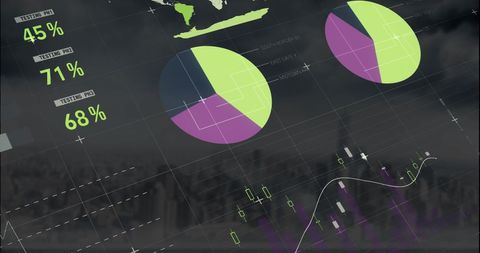
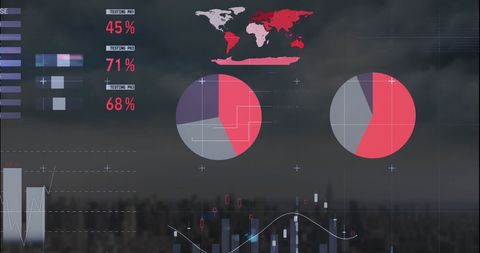
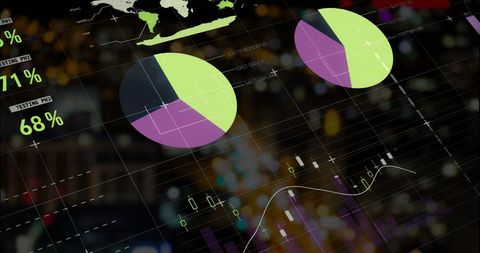
This intense depiction of a digital analytics dashboard features pinpoint world maps and dynamic graphs. Showcasing cutting-edge data visualization, the representation is ideal for illustrating business intelligence tools, IT solutions, or global digital connection concept applications.

Powered by Adobe logo
World map displaying global digital network and data hot spots - Powered by Adobeglowing digital world map with pixelated continents overlaid by orange fluctuating stock lines and data points a dynamic and tense global market visualization - Powered by AdobeFuturistic digital map with glowing location pins, travel lines connecting cities, dark background with data overlays - Powered by Adobeglowing digital world map with pixelated continents overlaid by orange fluctuating stock lines and data points, a dynamic and tense global market visualization - Powered by AdobeA business professional interacts with a digital interface, displaying graphs and a world map that showcases data analytics and global insights for decision-making. Cipher - Powered by Adobe

Credit Photo

If you would like to credit the Photo, here are some ways you can do so

Free (free of charge)

Free for personal and commercial use.

Author: Creative Art

Similar Free Stock Images

Loading...
Financial Data Analytics Visualizing Over Planet Earth
Premium
Hand pointing at a world map with stock market charts and data overlays indicating global financial activity
Digital Data and Business Analytics on Blue Background
Digital Interface with Financial Charts and Analytics
Premium
Global data links connecting retail science across a digital world map with glowing location pins and network lines.
Digital Screen Displaying Business Analytics and Data Visualization
Advanced Data Interface with Stock Market Analytics Graphics
Abstract Digital Interface with Charts and Graphs Overlay
Futuristic Data Analytics Visualization with Global Interface
Premium
Abstract digital world map with glowing data points and graphical user interface elements displayed
Futuristic Financial Chart Overlay with Cityscape Background
Digital Interface with Graphs and Network Connections for Data Processing
Data Analysis Overlapping Tech Graphics on Server Lights
Premium
International Economic Policy Framework, Digital world map with data visualization elements.
Colorful Pie Charts and Graphs for Digital Data Analysis Presentation
Digital Infographic Overlay with Construction Theme
Futuristic Digital Interface with Financial Data Graphs
Global Financial Data and Analytics Visualization Concept
Premium
Global data network visualization, digital map with glowing lines
Digital Data Analysis and Visualization Over Modern Cityscape
Digital Infographic and Cityscape Displaying Global Business Data
Infographic Interface Display over Cityscape at Dawn
Digital Infographic and City Traffic with Moving Vehicles
Premium
Holographic earth globe displaying climate change data and global temperature variations under spotlights in a futuristic digital environment, emphasizing environmental issues.
Futuristic Digital Interface with Data Flow and Analytics
Global Data and Business Interface Concept with Earth Visualization
Global Technology with Holographic Data Interface
Dynamic Data Analytics with Graphs and Charts
Futuristic Digital Interface with Graphs and Charts in Blue Tones
Dynamic Digital Dashboard with Analytics and Visualizations
Futuristic HUD Interface with Neon Graphs and Analytics
Abstract Visual: Data Analytics and Graph Processing Concept
Global Finance Data Visualization Over Urban Cityscape
Global Digital Data Interface with Charts and Graphs
Digital Data Visualization on Global Holographic Map
Futuristic Data Visualization with Charts and Graphs on Black Background
Business Analytics Technology Over Cityscape Conceptual
Data Analytics with World Map and Stock Market Graph Icons
Digital Patterns of Data Analytics with World Map Overlay
Premium
Abstract digital visualization of global finance and technology trends with data analysis graphics and world map representation.
Futuristic Data Analysis Interface with Graphs and Charts
Futuristic Data Visualization with Pie Charts and World Map
Financial Data Analytics Over Cityscape with Digital Graphics
Premium
Digital world map visualization with glowing red and black theme, global network, data technology, and futuristic cyber communication concept
Financial Data Dashboard with Global Infographic Elements
Abstract Financial Report Data with Graphs and World Map
Digital Data Processing with Graphs and Maps Interface
Digital Interface with Graphs Over construction Site
Premium
A digital map showcasing global connectivity with illuminated lines representing networks and data flow across continents.
Global Financial Statistics and Data Processing on Building Background
Financial Analytics Over Cityscape with Graphs and Charts
Abstract Business Data Visualization with Cityscape Background
Digital Infographics over Cityscape Analyzing Business Growth and Progress
Premium
Holographic earth digital globe data network global map satellite orbit africa continent europe continent data center server room futuristic technology. Holographic earth digital globe data
Global Financial Data Visualization with Statistics and Charts
Digital Data and Financial Charts on Dark Interface
Futuristic Digital Interface Displaying Complex Data Visualizations
Futuristic Data Analytics Overlay on Dark Background
Premium
Digital world map with data visualization in vibrant orange and blue tones highlighting geographical details and trends
Financial Data with Pie and Bar Graphs on Dark Digital Background
Futuristic Dashboard with Dynamic Data Visualization and Heatmap
Data Analytics Overlay on City Skyline Illustrating Futuristic Business Trends
Futuristic Interface with Data Visualizations and Analytics
Global Financial Data Analysis Over High-Speed Cityscape
Premium
This digital rendering showcases the world map formed by interconnected data lines and dots, symbolizing global networking.
Global Business Analytics with Digital Interface Over Cityscape
Dynamic Digital Interface with Question Marks on Statistics Background
Data Processing Overlay on Urban Landscape with Graph
Premium
Vibrant digital world map adorned with dynamic blue wave patterns, illustrating the interconnectedness of global technology, data streams, and innovative communication networks
Premium
Digital illustration of a glowing upward arrow over orange 3D bar graphs with a world map background symbolizing global growth and data analysis
Digital Data Visualization with Futuristic Analytics Interface
Innovative Global Business Data Interface Concept
Digital Financial Charts and Data Visualization 4K
Premium
Business analytics and data visualization on laptop screen
Business Professionals Analyzing Emerging Financial Data Trends
Statistical Data Visualization Over Aerial Cityscape Background
Premium
Global financial market data visualization with digital world map and fluctuating stock charts in a futuristic blue neon light abstract background
Multicolored Infographic Interface Over Cityscape
Global Data Analysis and Visualization Interface
Futuristic Business Interface with Data Charts Against Skyscraper
Global Financial Data Interface on Modern Building Background
Premium
Stunning illuminated map of Europe highlighting connections and infrastructure, ideal for data visualizations, global business, and tech concepts
Cityscape Overlaid with Data Analytics Infographics
Abstract Business Data Analytics and Statistics Visualization
Infographic Interface Overlay on Modern Urban Architecture
Business Data Analysis Overlay on Stormy Sky Background
Premium
Global network analysis with magnifying glass over vintage world map and data visualizations
Abstract Global Data Analytics Interface with Cityscape Background
Global Data Analysis with Pie Charts and Financial Graphs
Abstract Digital Dashboard with Data Visualizations
Premium
Future concepts in digital technology with glowing numbers and map details
Premium
Security analyst monitoring data and global activity on multiple digital dashboards.
Corporate analytics dashboard displaying global map, dual pie charts and financial data
Data Driven Technology Statistics and Graph Analytics
Dynamic Financial Data Visualization Over Black Background
Digital Analytics and Global Financial Data Visualization
Premium
Business analyst reviewing global data charts with digital analytics.
Data Analysis Dashboard Overlaid on Night City Traffic Background
Abstract Data Visualization with City Skyline
Digital Analytics Dashboard Interface Over City
Futuristic Data Visualization in Dark Interface Design
Global Data Processing with Digital Interface Concepts
Futuristic Digital Interface Displaying Data and Graphs
Complex Financial Analytics and Data Visualization in Digital Space
Data Visualization Over Cityscape
Futuristic Interface with Data Highlights and Analytics
Digital world: interactive data visualization dashboard
Businessman Analyzing Digital Global Financial Data
Abstract Financial Analytics Interface with World Map and Data Charts
Premium
Suited hand pointing at a glowing digital world map on a touchscreen, highlighting data nodes, networks, and global connectivity.
Digital Data Visualization with Code and Analytical Charts
Global Financial Data Analysis with Charts and Diagrams
Financial Data and Cityscape Highlighting Global Business Trends
Digital Financial Data Analytics with Pie Charts and Graphs
Premium
This graphic presents a digital representation of global economic growth trends with a clear upward arrow. The world map serves as a backdrop to illustrate international data
Financial Data and Analytics Visualization in Digital Interface
Digital Interface with Mathematical Equations and Pie Charts
Global Financial Data Processing with Charts and Graphs
Big Data Analytics with Futuristic Interface and Graphs
Premium
Global digital globe with illuminated continents and futuristic circuitry data visualization for a tech and finance audience
Data Visualization with Financial Graphics on Abstract Background
Digital Data Visualization Over City Lights Background
Abstract Data Analytics Interface with Global Charts and Visualizations
Digital Analytics Dashboard with Blue Pie Chart and Code Overlay
Premium
Detailed map of Europe highlighted by bright connections, illustrating the importance of global networks in a modern digital landscape
Explore More Free Stock Images