- Home >
- Stock Photos >
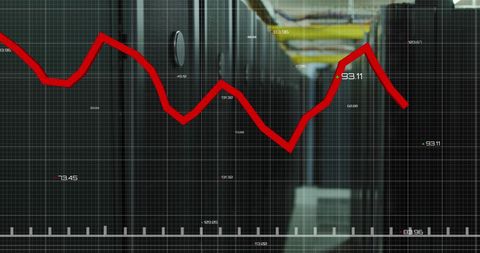
- Digital Analytics Dashboard with Red Line Graph
Digital Analytics Dashboard with Red Line Graph Image
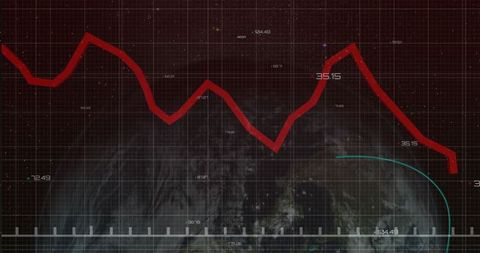
The image shows a digital dashboard featuring a red fluctuating line graph against a dark grid background. Numeric data labels offer statistical insights, facilitating a modern visualization of data trends. Ideal for illustrating concepts in analytical presentations, statistics-driven articles, or digital marketing strategies requiring a robust depiction of data analysis and business intelligence.

downloads
Tags:
More
Credit Photo
If you would like to credit the Photo, here are some ways you can do so
Text Link
photo Link
<span class="text-link">
<span>
<a target="_blank" href=https://pikwizard.com/photo/digital-analytics-dashboard-with-red-line-graph/a2b23dc59a532629286616842b43f459/>PikWizard</a>
</span>
</span>
<span class="image-link">
<span
style="margin: 0 0 20px 0; display: inline-block; vertical-align: middle; width: 100%;"
>
<a
target="_blank"
href="https://pikwizard.com/photo/digital-analytics-dashboard-with-red-line-graph/a2b23dc59a532629286616842b43f459/"
style="text-decoration: none; font-size: 10px; margin: 0;"
>
<img src="https://pikwizard.com/pw/medium/a2b23dc59a532629286616842b43f459.jpg" style="margin: 0; width: 100%;" alt="" />
<p style="font-size: 12px; margin: 0;">PikWizard</p>
</a>
</span>
</span>
Free (free of charge)
Free for personal and commercial use.
Author: People Creations