- Home >
- Stock Photos >
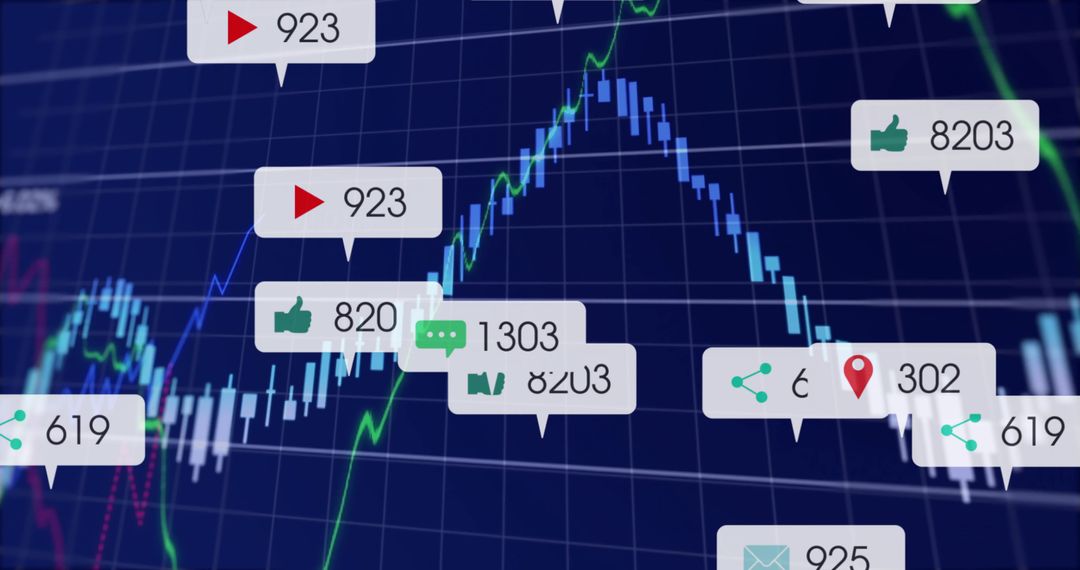
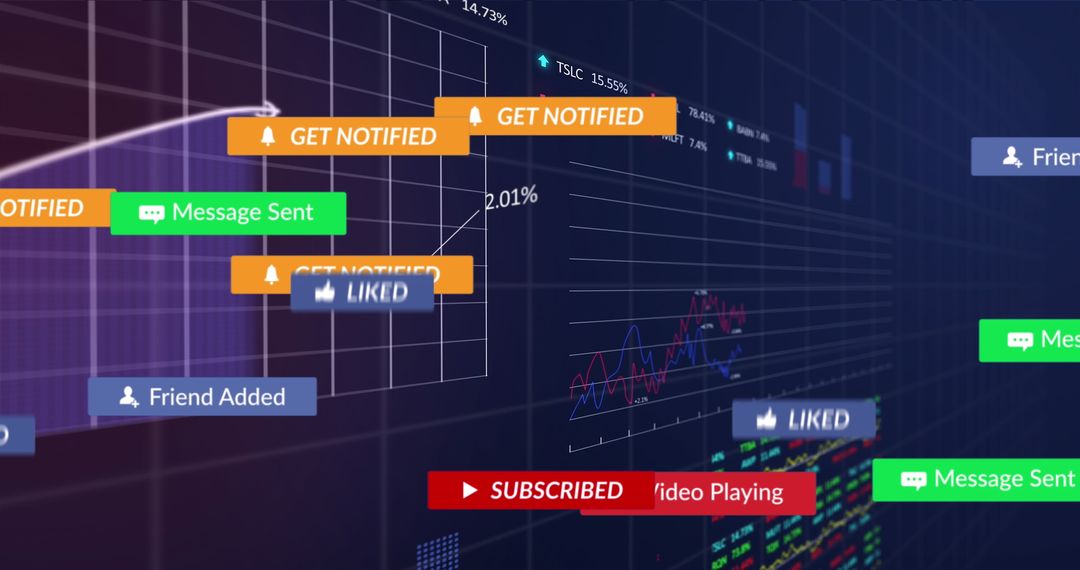
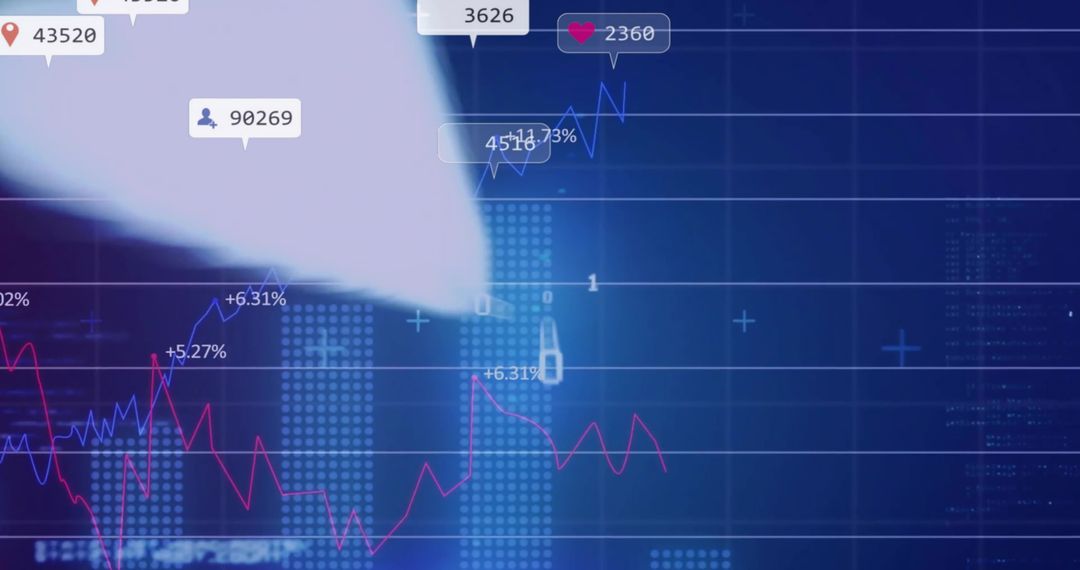
- Digital Analytics Dashboard with Social Media Metrics
Digital Analytics Dashboard with Social Media Metrics Image

Dashboard displaying interactive graphs in red and blue tones. Social media interactions like 'Message Sent' and 'Liked' float over lines, illustrating trends and statistics in a digital format. Ideal for use in technology, analytics insights, and presentations focusing on social engagement trends.
Powered by 


0
downloads
downloads
Tags:
More
Credit Photo
If you would like to credit the Photo, here are some ways you can do so
Text Link
photo Link
<span class="text-link">
<span>
<a target="_blank" href=https://pikwizard.com/photo/digital-analytics-dashboard-with-social-media-metrics/e92a78873807fe087af52ecf449b9853/>PikWizard</a>
</span>
</span>
<span class="image-link">
<span
style="margin: 0 0 20px 0; display: inline-block; vertical-align: middle; width: 100%;"
>
<a
target="_blank"
href="https://pikwizard.com/photo/digital-analytics-dashboard-with-social-media-metrics/e92a78873807fe087af52ecf449b9853/"
style="text-decoration: none; font-size: 10px; margin: 0;"
>
<img src="https://pikwizard.com/pw/medium/e92a78873807fe087af52ecf449b9853.jpg" style="margin: 0; width: 100%;" alt="" />
<p style="font-size: 12px; margin: 0;">PikWizard</p>
</a>
</span>
</span>
Free (free of charge)
Free for personal and commercial use.
Author: Authentic Images
Similar Free Stock Images

Premium


Premium


Premium


Premium


Premium


Premium


Premium


Premium


Premium


Premium


Premium


Premium


Premium


Premium


Premium


Premium


Premium


Premium


Premium


Premium


Premium


Premium


Premium


Premium