- Home >
- Stock Photos >
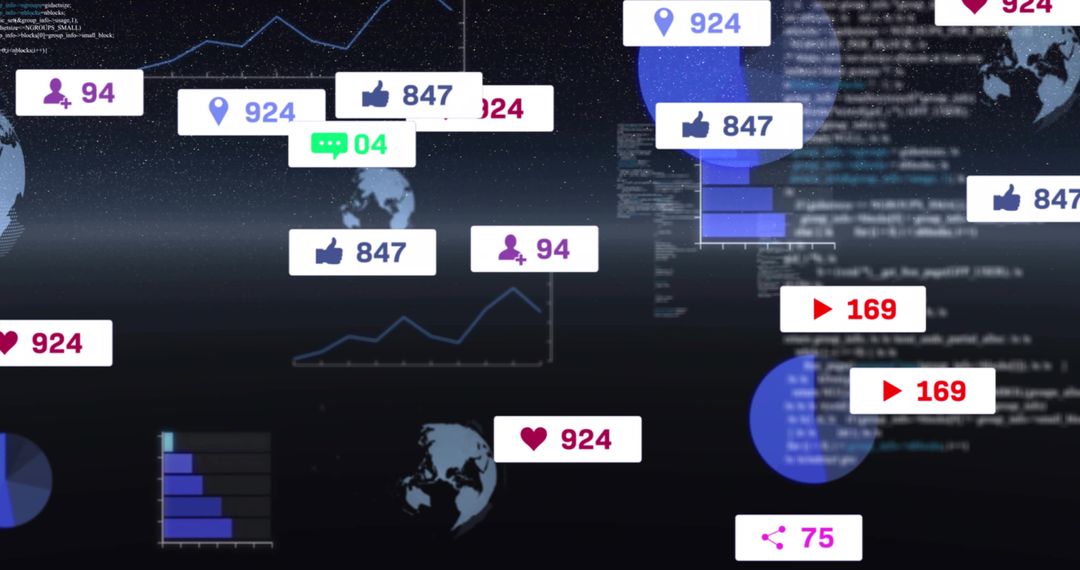
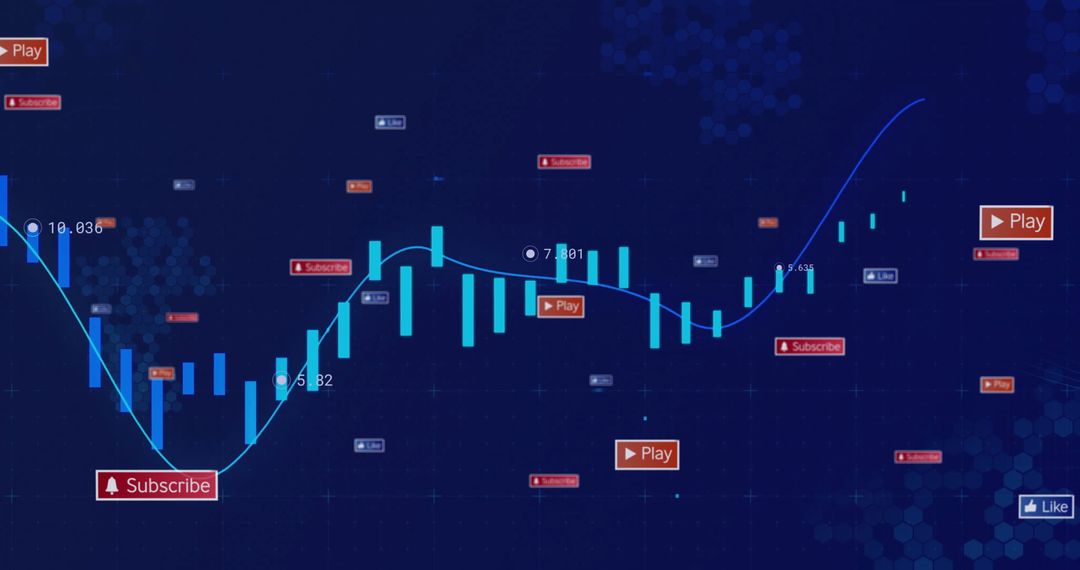
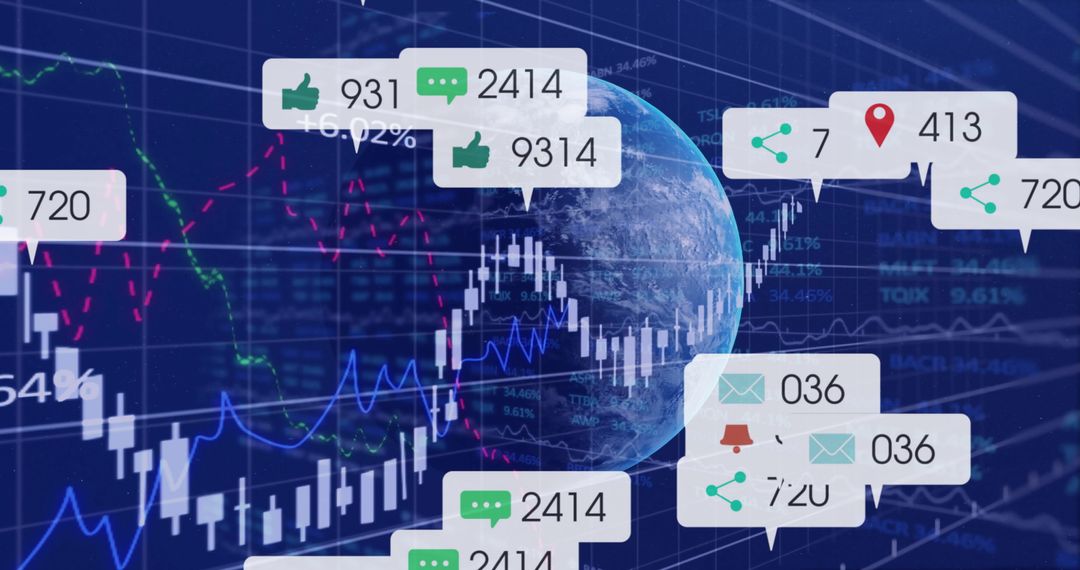
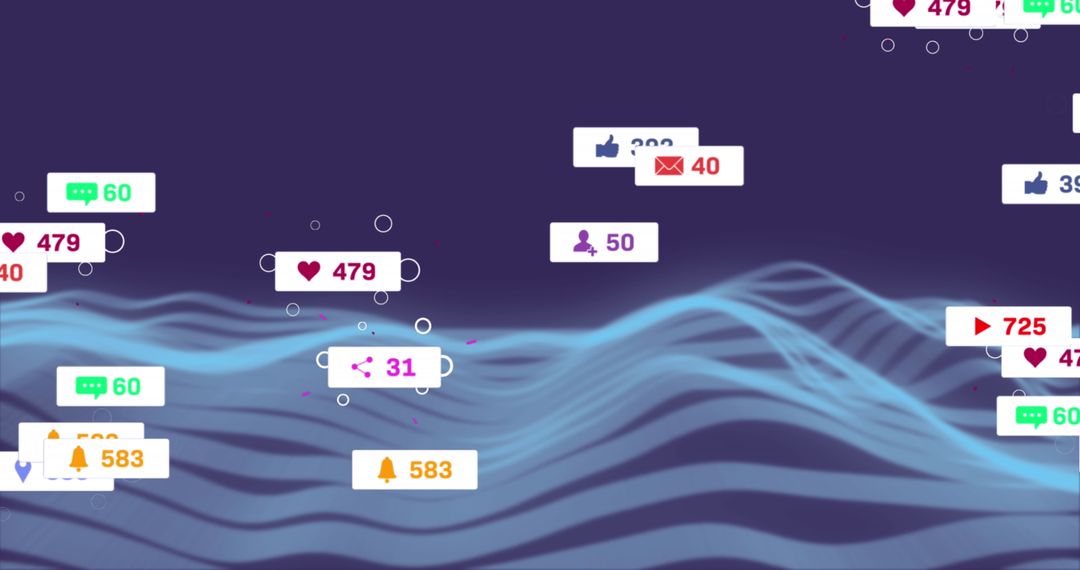
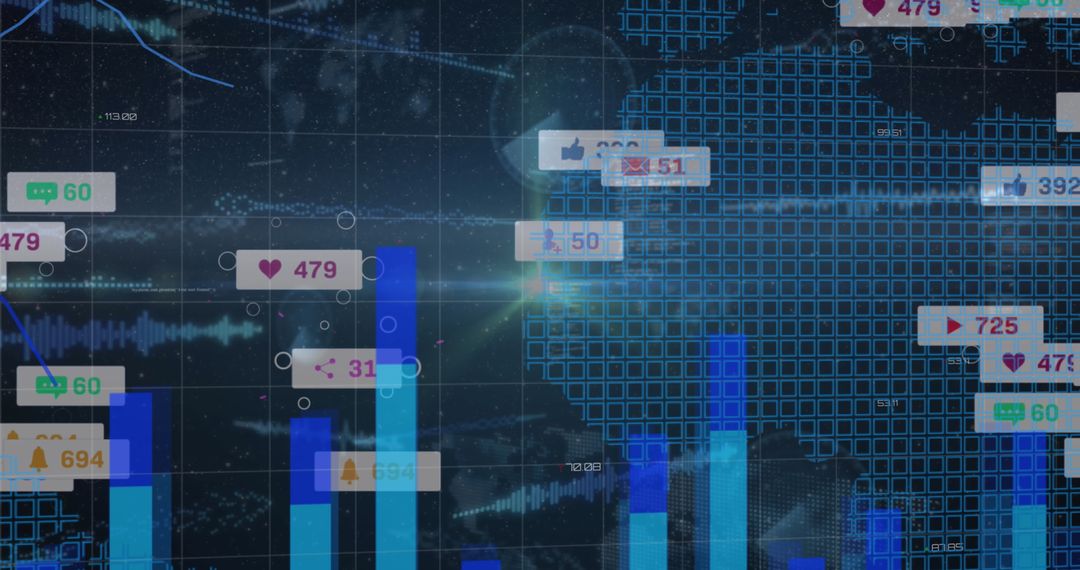
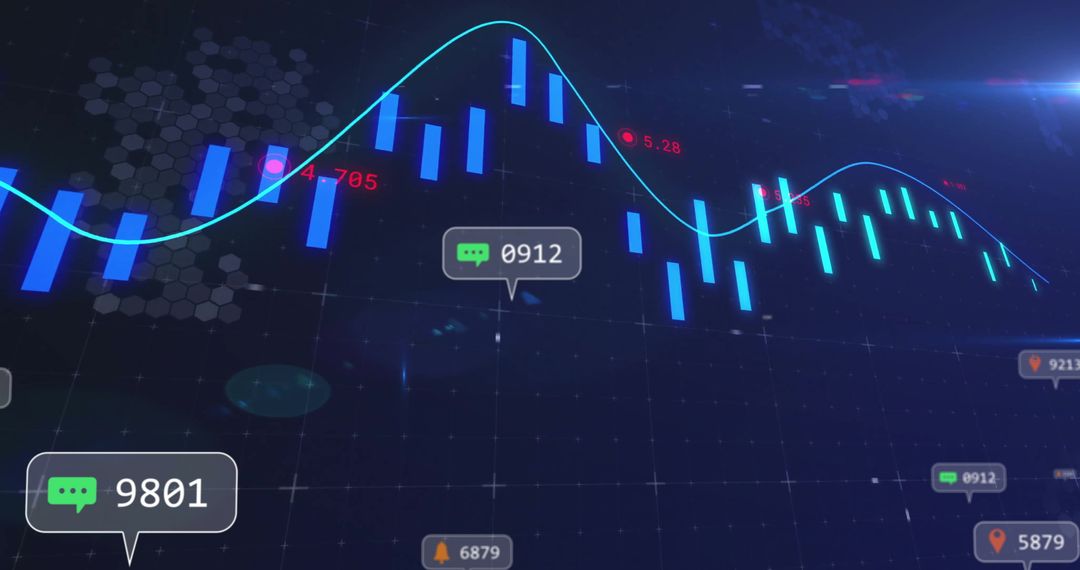
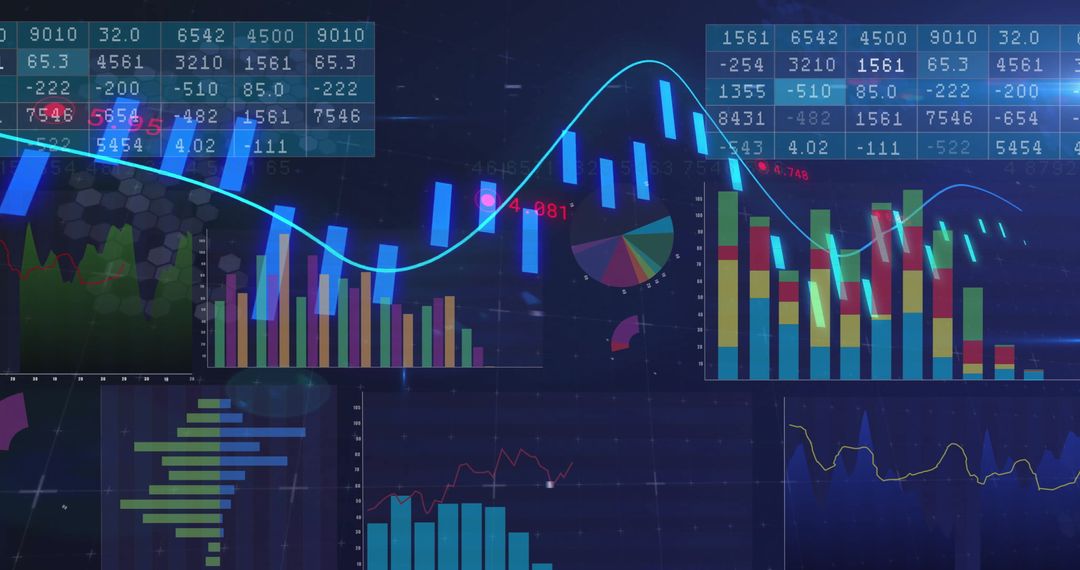
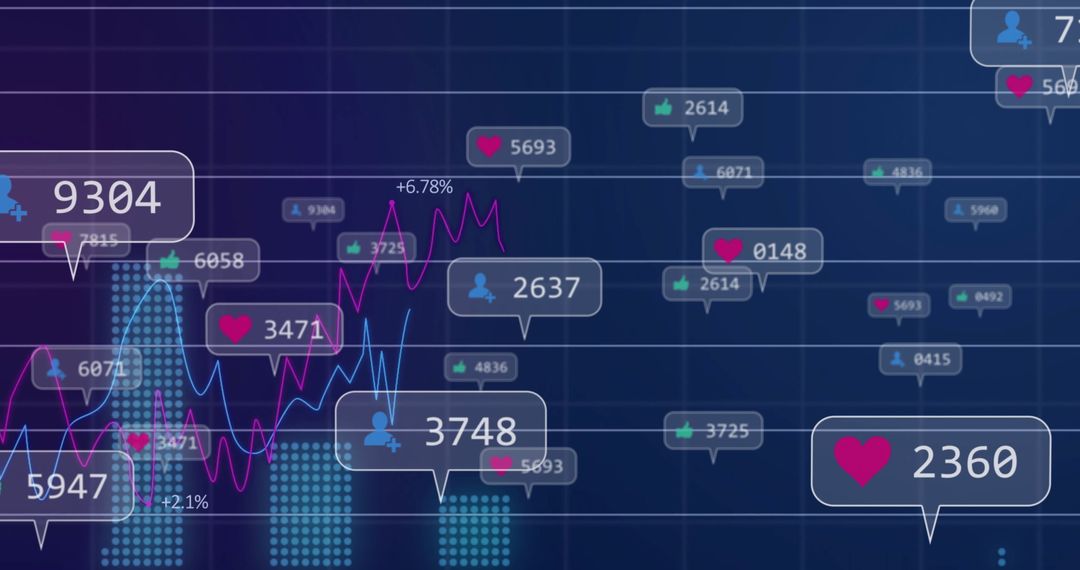
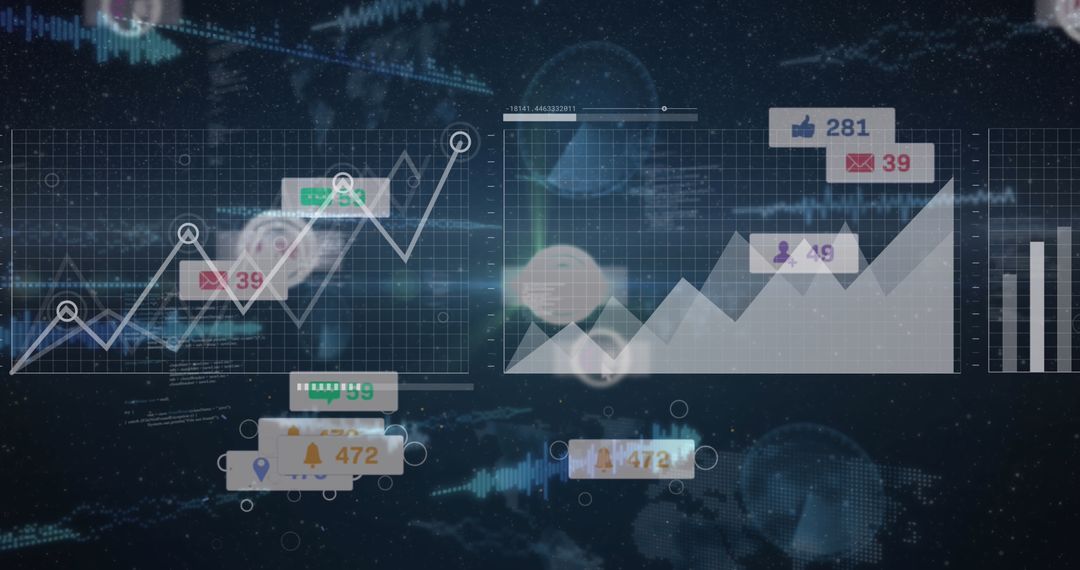
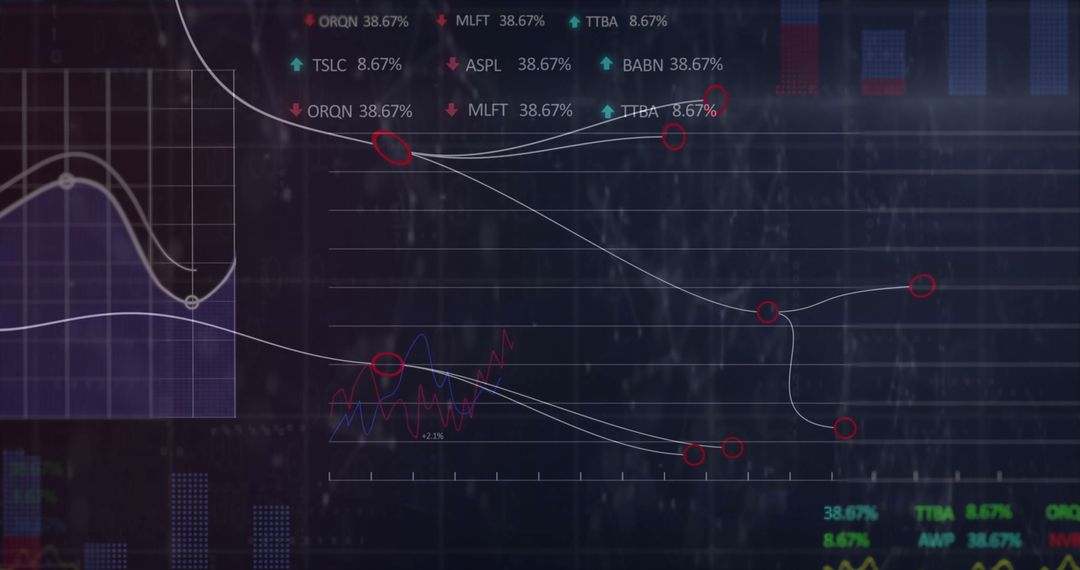
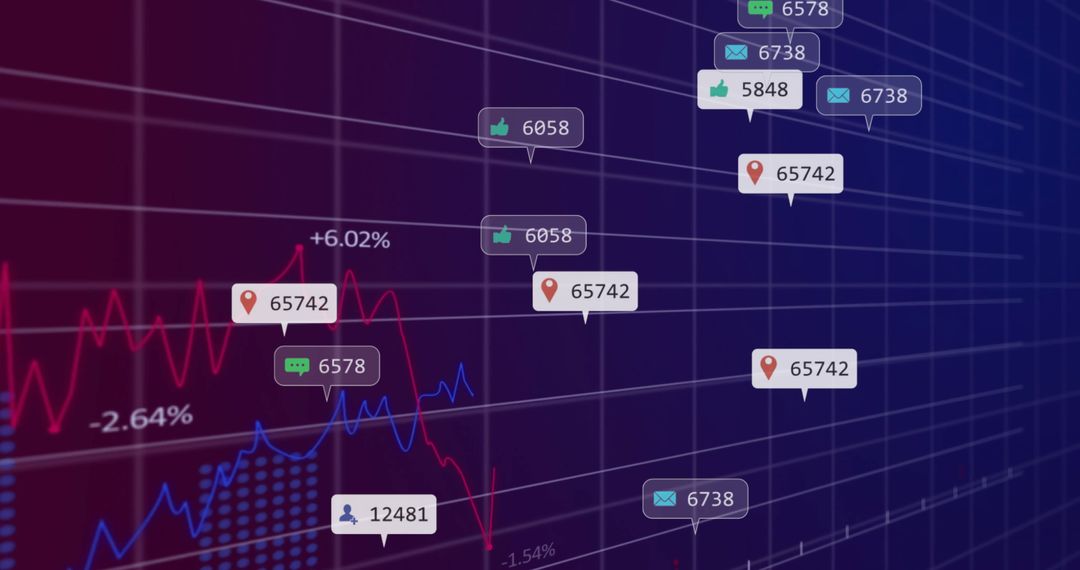
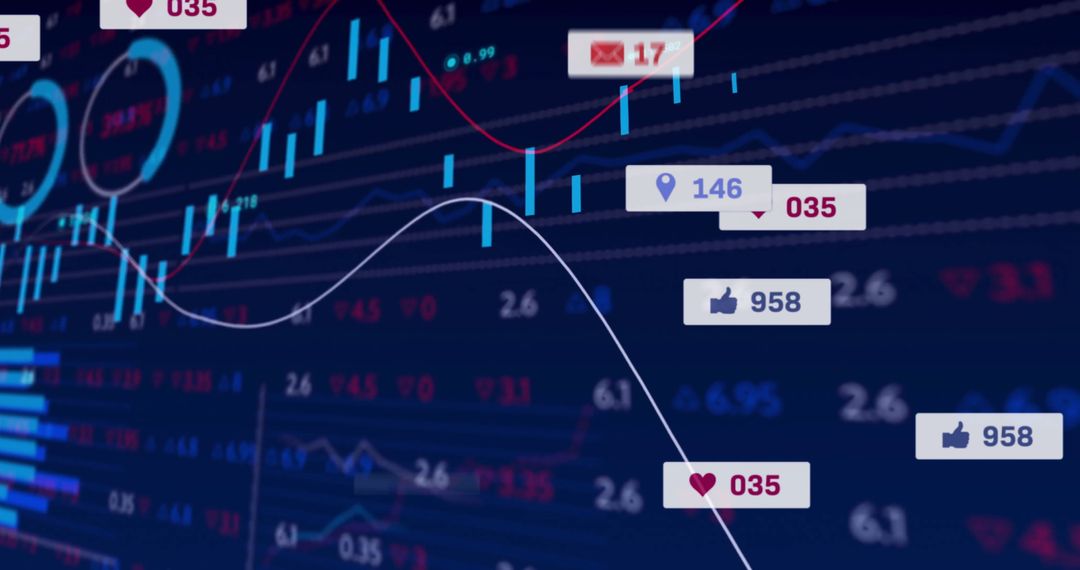
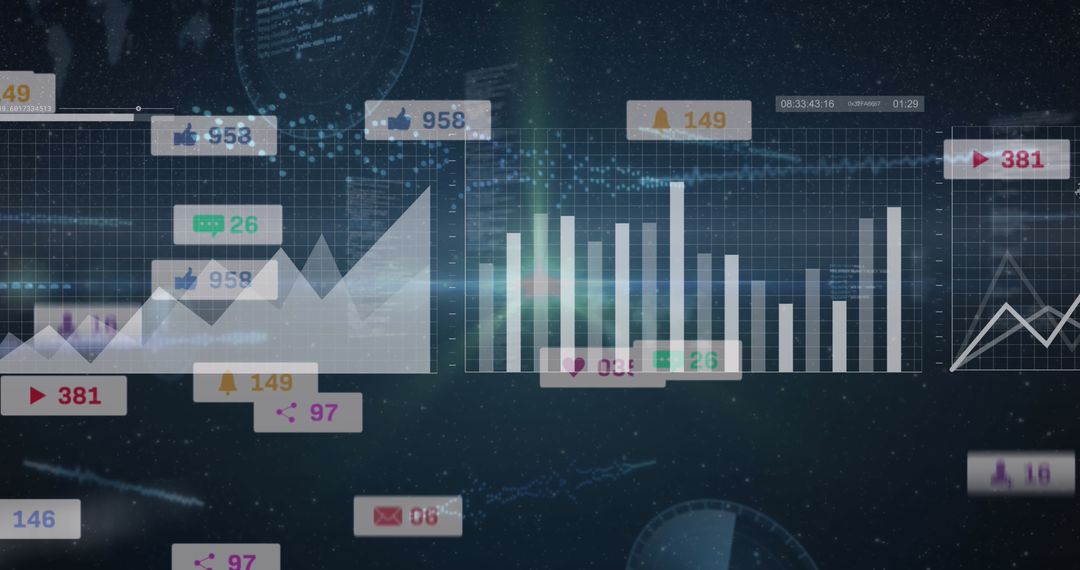
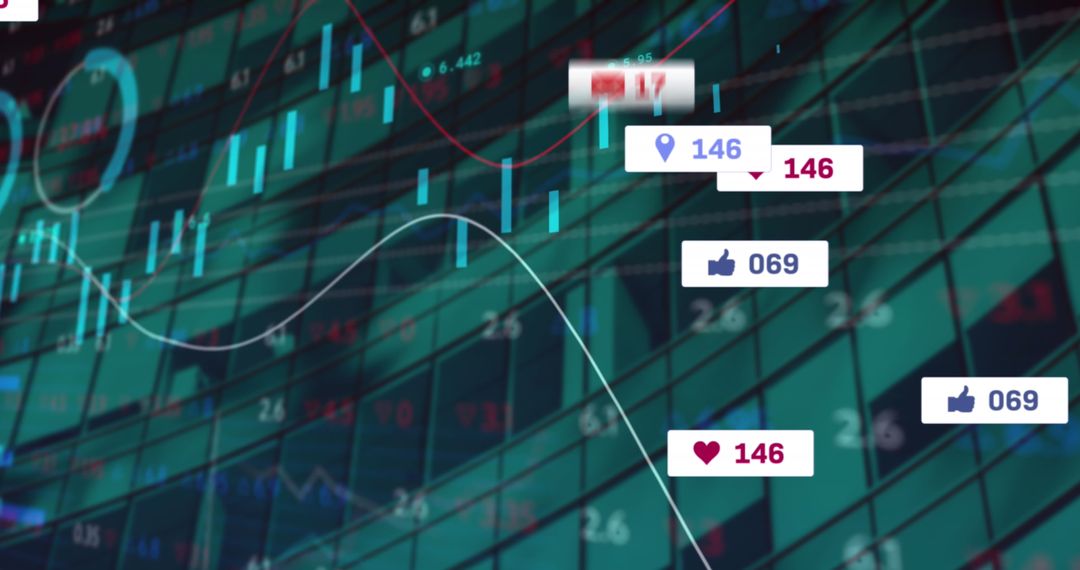
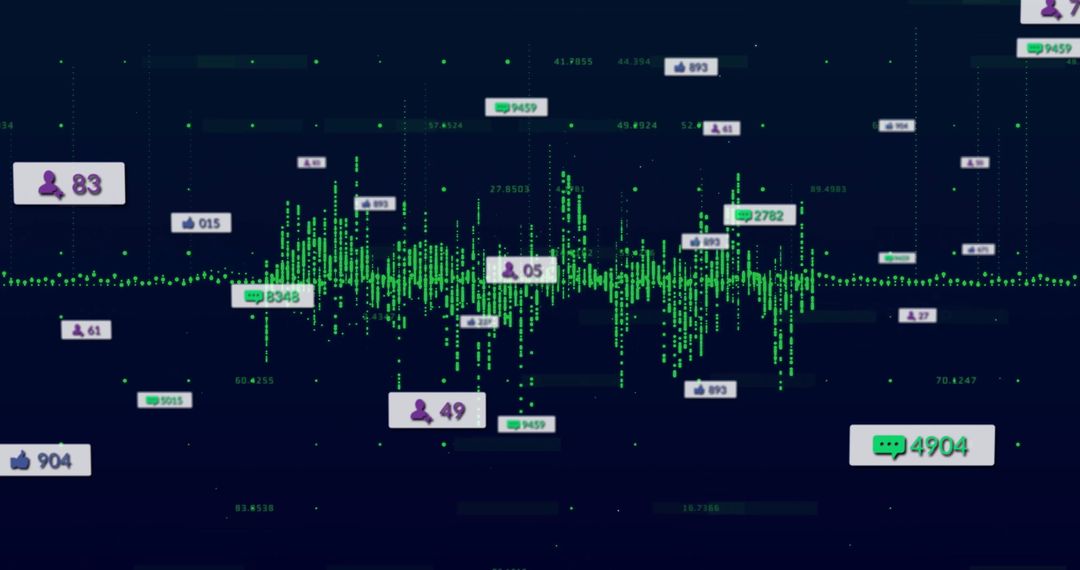
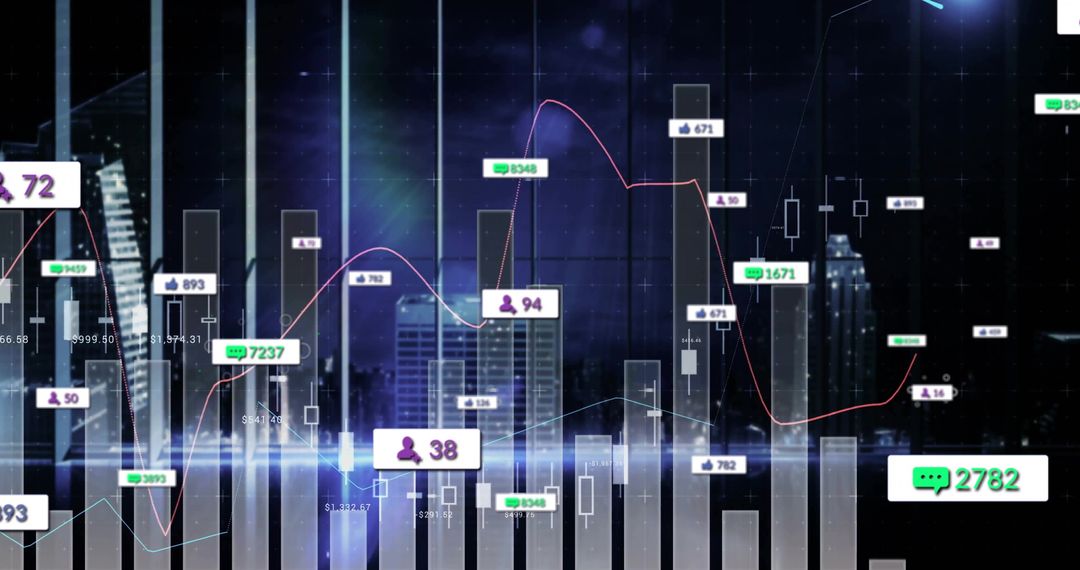
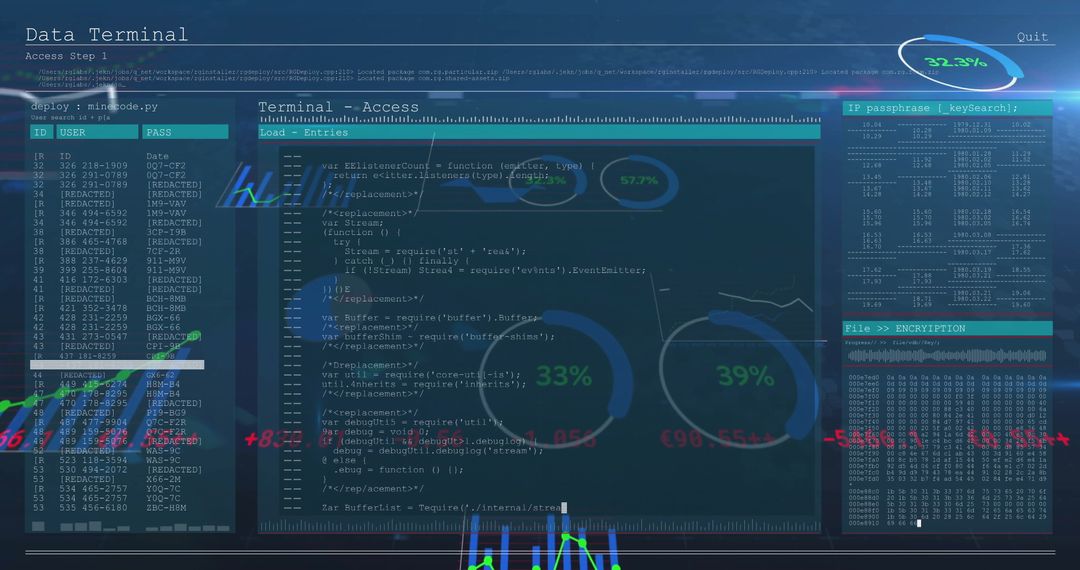
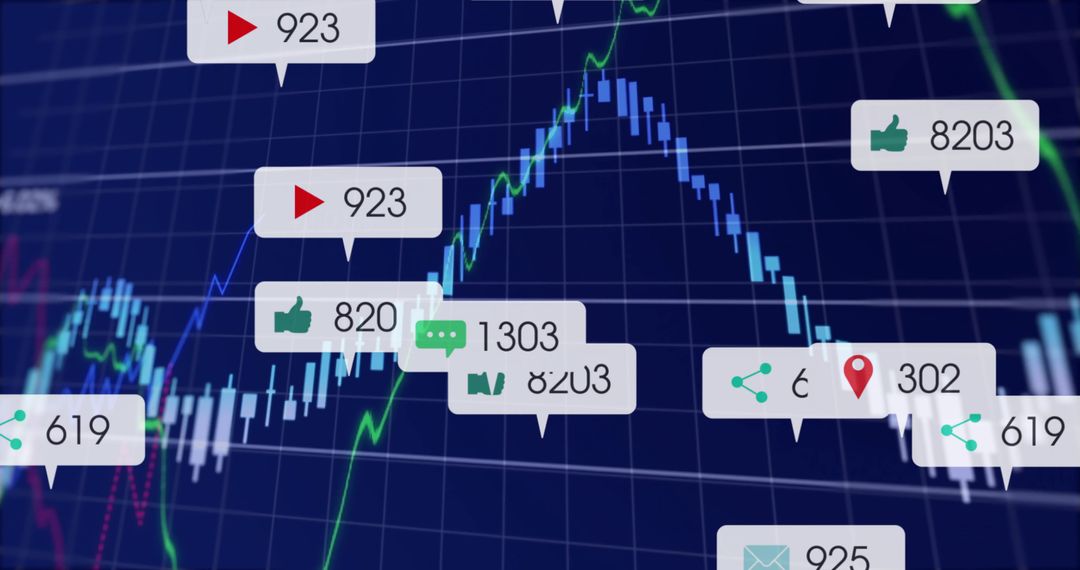
- Digital Analytics Dashboard with Social Metrics and Chart Visualization
Digital Analytics Dashboard with Social Metrics and Chart Visualization Image
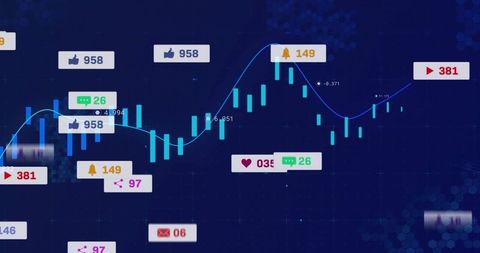
The illustration displays an analytics dashboard featuring a candlestick chart with social media engagement icons. It effectively combines data visually with various social interaction symbols like likes and alerts, highlighting the intersection of social media performance and financial data. This image is ideal for presentations or content related to digital marketing, data-driven decision-making, business analysis, technology trends, or enhancing user engagement strategies. It emphasizes understanding metrics and optimizing online presence through technological insights.
Powered by 


0
downloads
downloads
Tags:
More
Credit Photo
If you would like to credit the Photo, here are some ways you can do so
Text Link
photo Link
<span class="text-link">
<span>
<a target="_blank" href=https://pikwizard.com/photo/digital-analytics-dashboard-with-social-metrics-and-chart-visualization/4f5a2826f54db1ced0cee280d5738021/>PikWizard</a>
</span>
</span>
<span class="image-link">
<span
style="margin: 0 0 20px 0; display: inline-block; vertical-align: middle; width: 100%;"
>
<a
target="_blank"
href="https://pikwizard.com/photo/digital-analytics-dashboard-with-social-metrics-and-chart-visualization/4f5a2826f54db1ced0cee280d5738021/"
style="text-decoration: none; font-size: 10px; margin: 0;"
>
<img src="https://pikwizard.com/pw/medium/4f5a2826f54db1ced0cee280d5738021.jpg" style="margin: 0; width: 100%;" alt="" />
<p style="font-size: 12px; margin: 0;">PikWizard</p>
</a>
</span>
</span>
Free (free of charge)
Free for personal and commercial use.
Author: People Creations
Similar Free Stock Images

Premium


Premium


Premium


Premium


Premium


Premium


Premium


Premium


Premium


Premium


Premium


Premium


Premium


Premium


Premium


Premium


Premium


Premium


Premium


Premium


Premium


Premium

Premium


Premium