
- Home >
- Stock Photos >
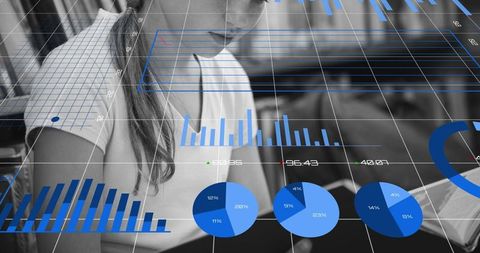
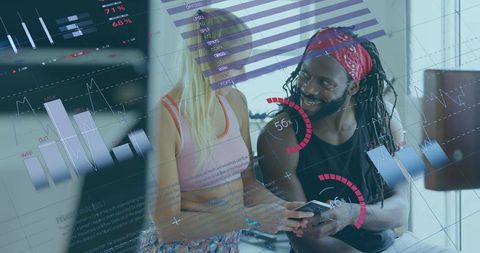
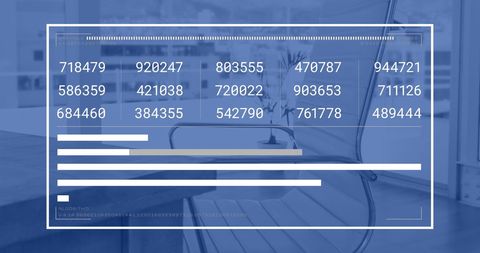
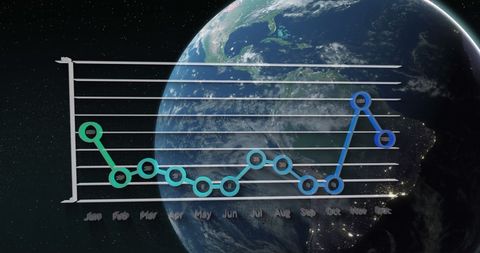
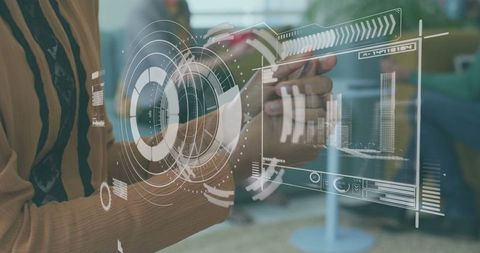
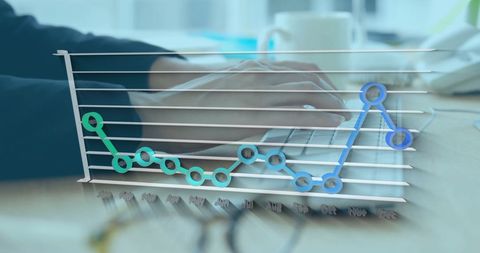
- Digital Analytics Display Merging Programming and Modern Technology
Digital Analytics Display Merging Programming and Modern Technology Image
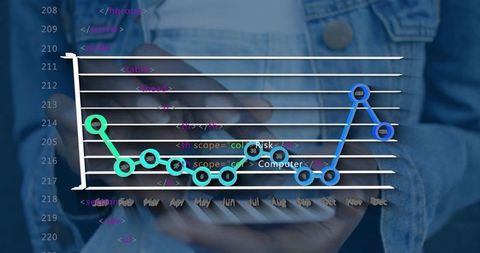
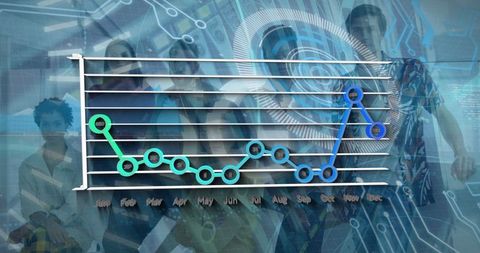
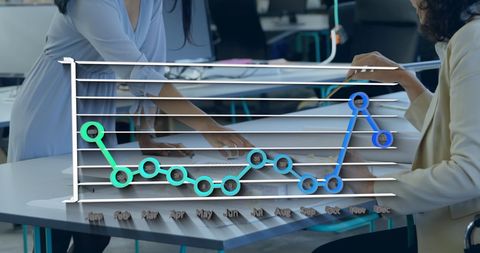
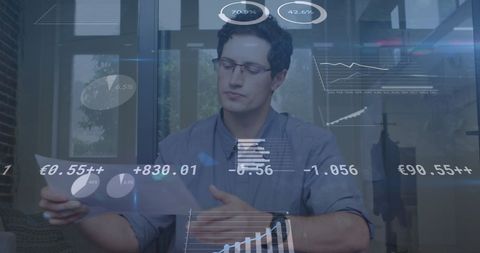
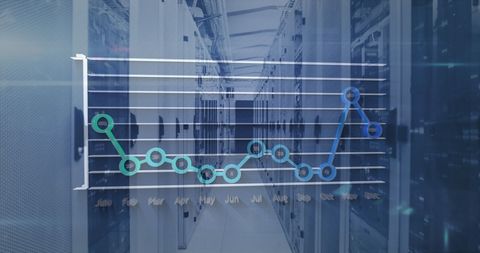
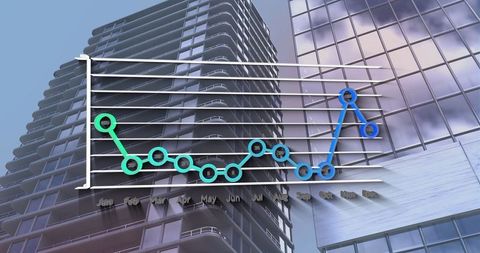
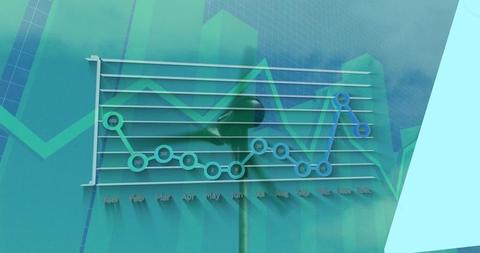
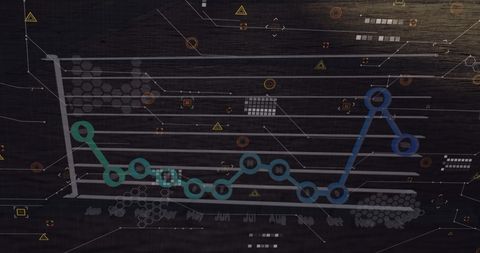
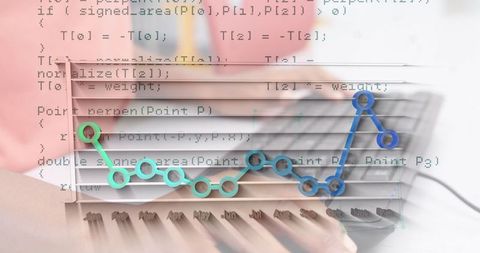
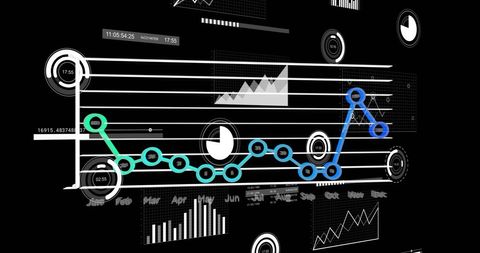
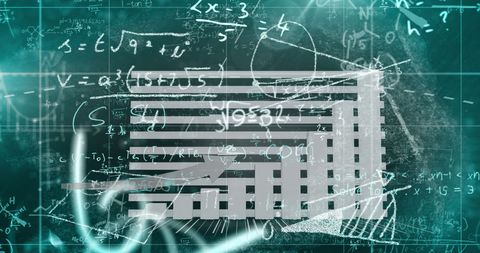
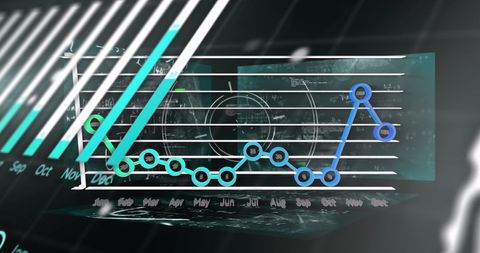
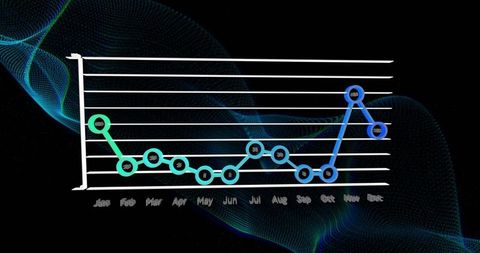
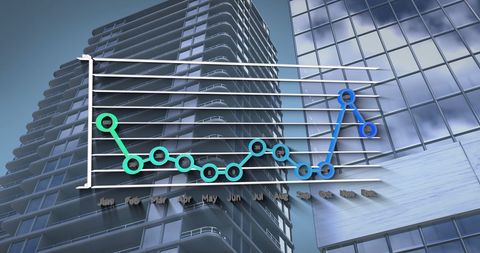
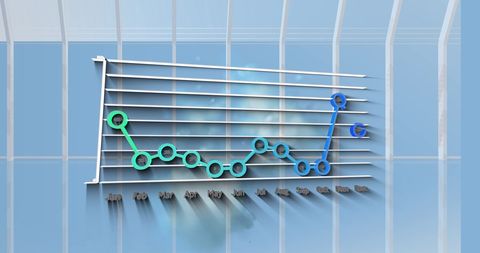
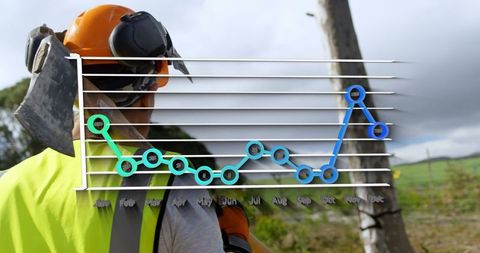
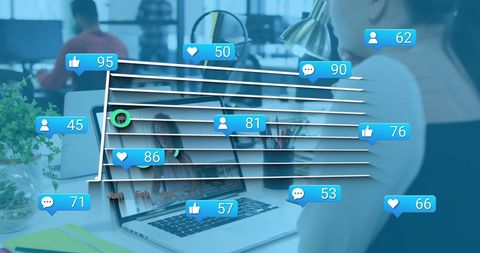
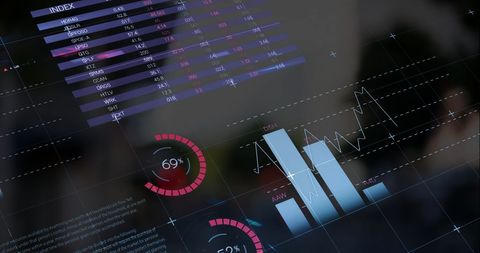
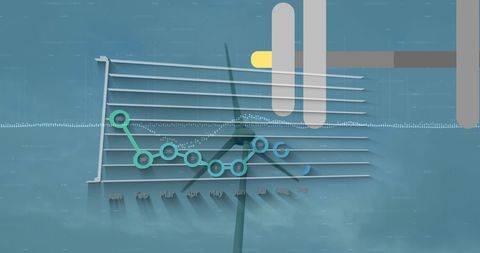
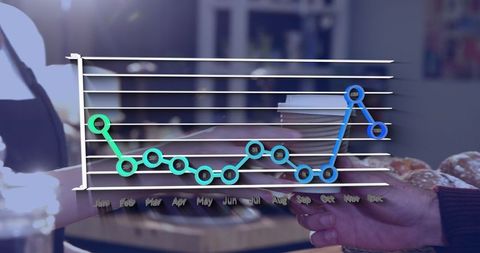
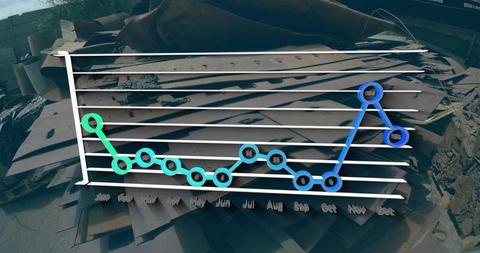
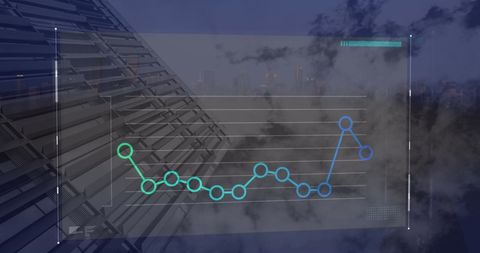
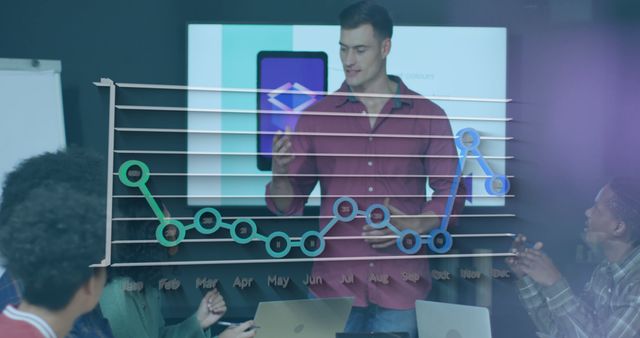
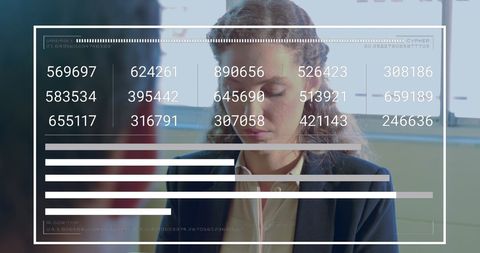
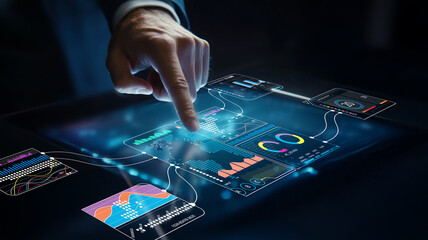
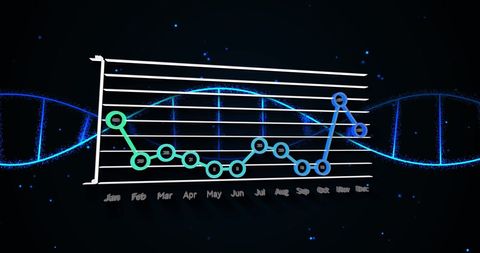
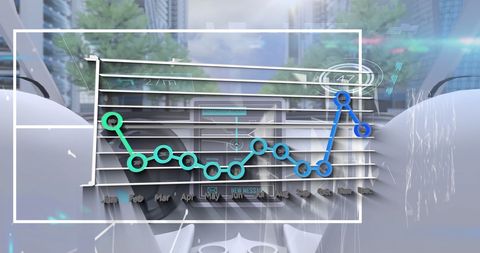
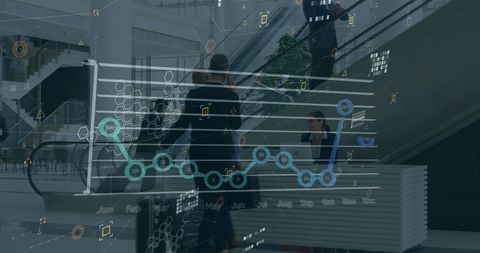
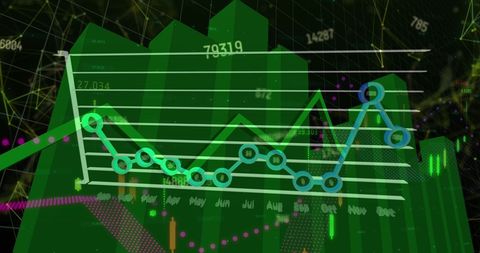
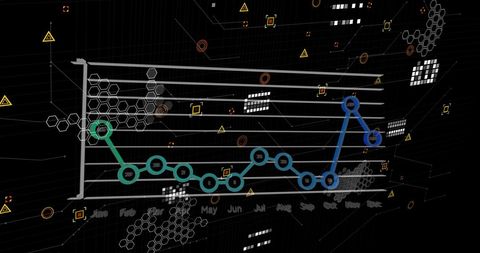
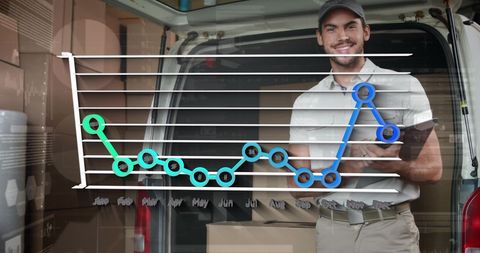
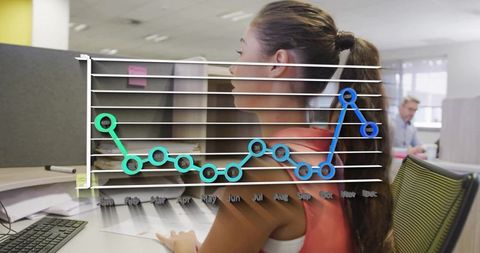
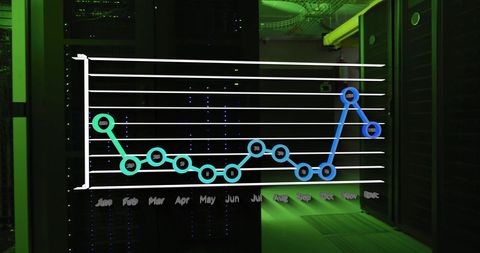
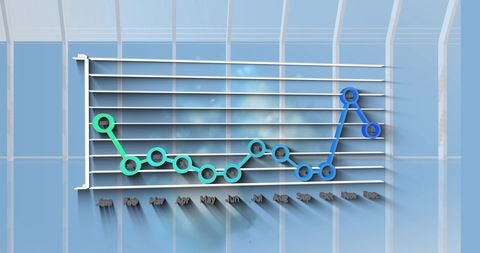
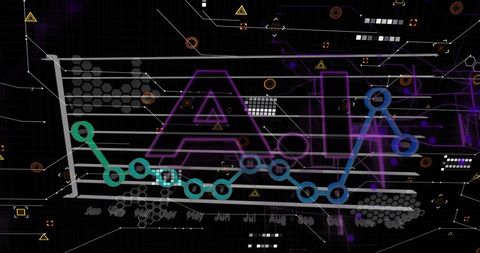
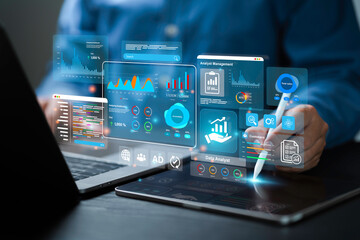
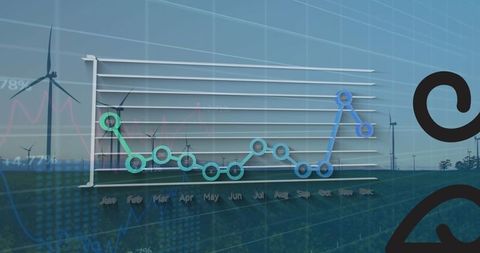
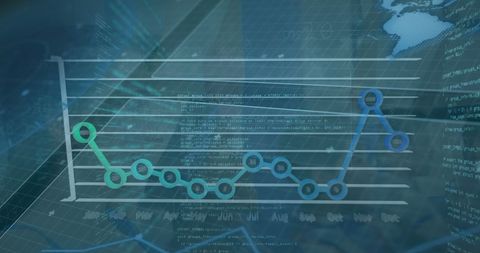
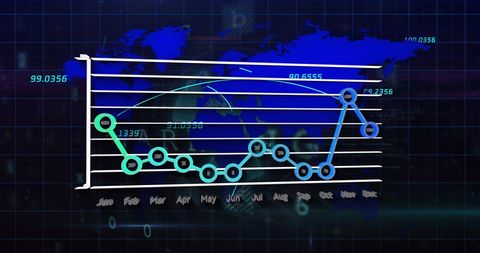
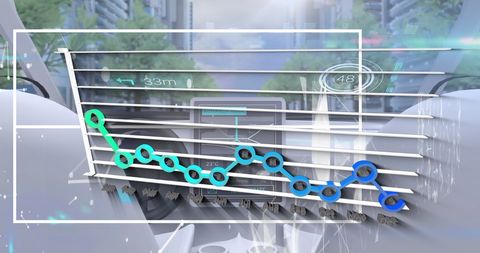
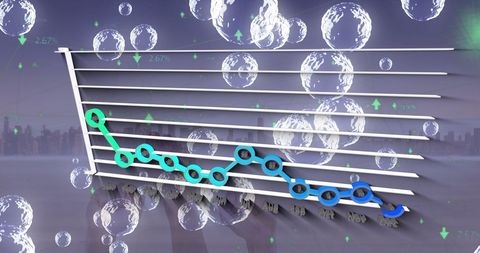
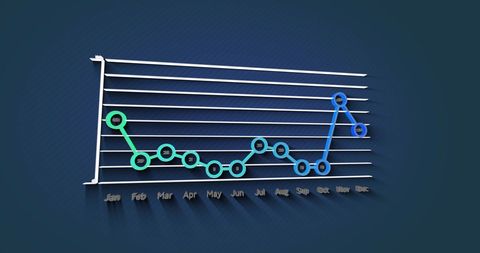
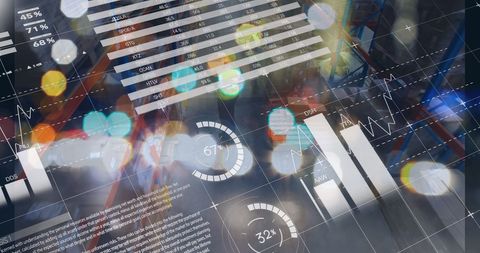
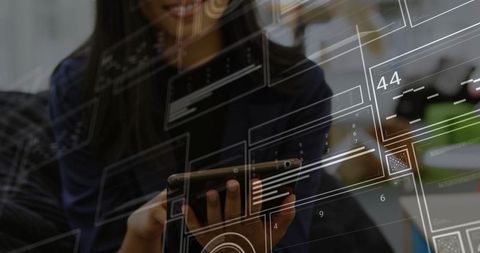
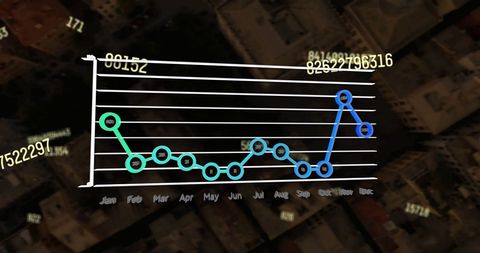
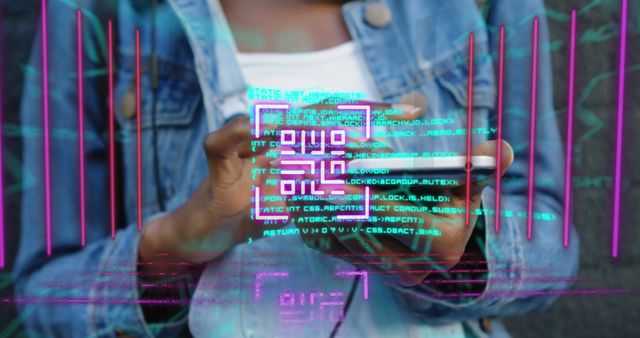
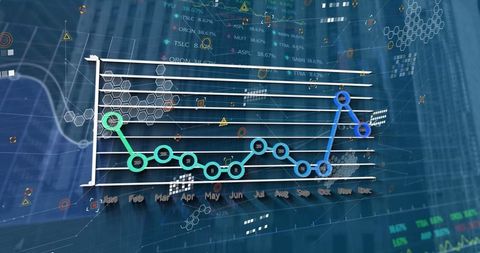
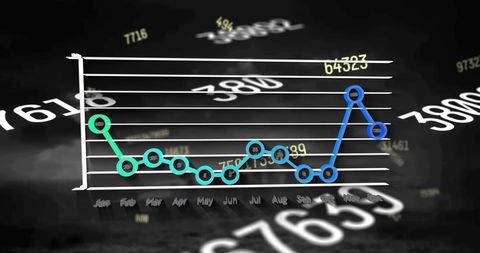
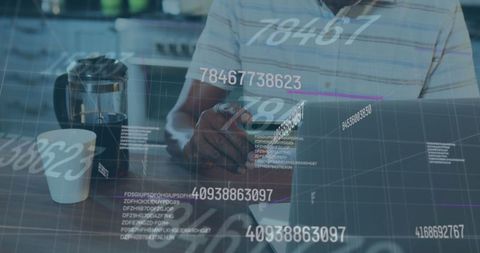
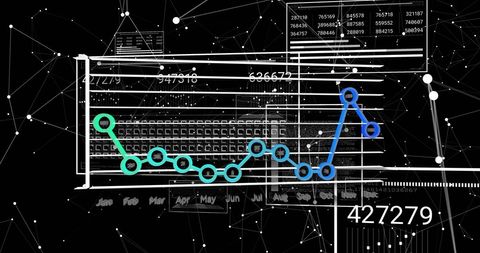
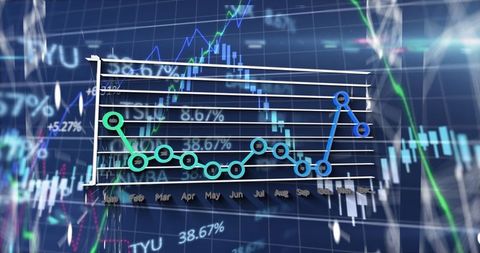
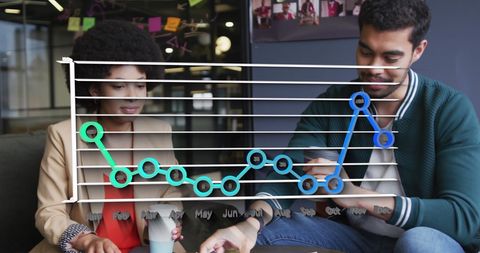
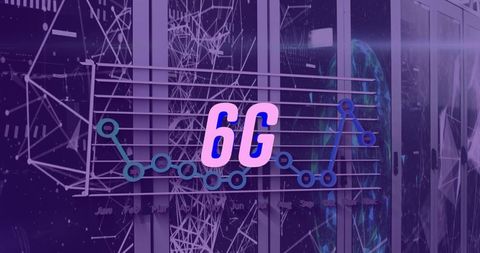
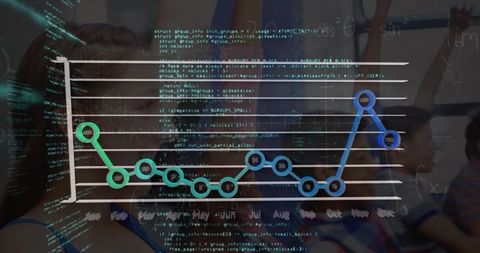
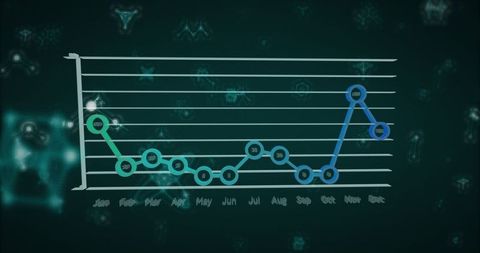
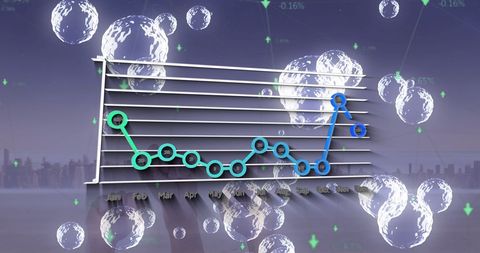
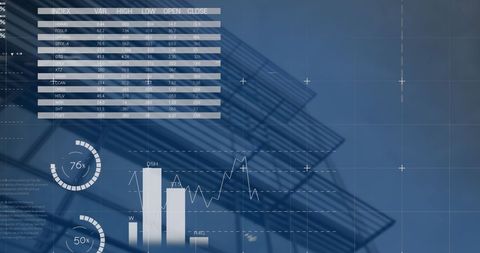
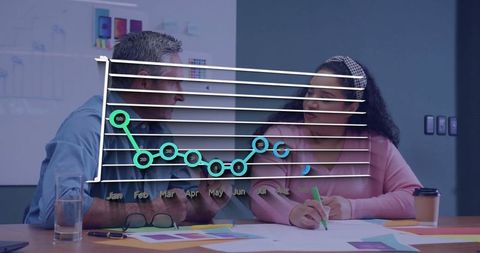
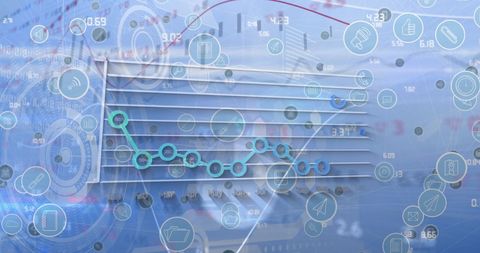
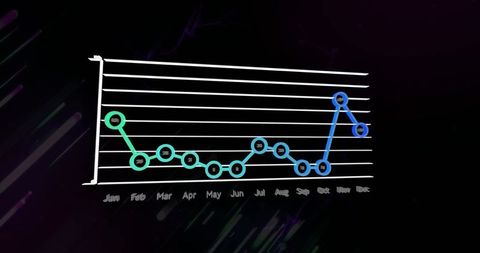
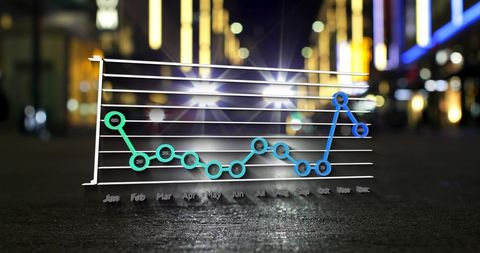
Hands of a woman holding a smartphone while a 3D line chart overlays the scene, surrounded by HTML code snippets. This image portrays the synergy between contemporary technology and analytical innovation, symbolizing expertise in data visualization and programming. Perfect for use in blogs, tech articles, marketing material for software companies, and courses on data analytics and interactive digital platforms.
Powered by 


downloads
Tags:
More
Credit Photo
If you would like to credit the Photo, here are some ways you can do so
Text Link
photo Link
<span class="text-link">
<span>
<a target="_blank" href=https://pikwizard.com/photo/digital-analytics-display-merging-programming-and-modern-technology/d8e6682ce6628a7f33105978f2e1a643/>PikWizard</a>
</span>
</span>
<span class="image-link">
<span
style="margin: 0 0 20px 0; display: inline-block; vertical-align: middle; width: 100%;"
>
<a
target="_blank"
href="https://pikwizard.com/photo/digital-analytics-display-merging-programming-and-modern-technology/d8e6682ce6628a7f33105978f2e1a643/"
style="text-decoration: none; font-size: 10px; margin: 0;"
>
<img src="https://pikwizard.com/pw/medium/d8e6682ce6628a7f33105978f2e1a643.jpg" style="margin: 0; width: 100%;" alt="" />
<p style="font-size: 12px; margin: 0;">PikWizard</p>
</a>
</span>
</span>
Free (free of charge)
Free for personal and commercial use.
Author: Awesome Content
Similar Free Stock Images
Premium


Premium
Premium

Premium

Premium


Premium


Premium

Premium
Premium

Premium


Premium


Premium

Premium

Premium
Premium


Premium

Premium

Premium
Premium

Premium


Premium

Premium

Premium

Premium

Premium

Explore More Free Stock Images