1. Home > 
  2. Stock Photos > 
  3. Digital Analytics Graphs Overlaying Urban Skyline Conceptual Art

Digital Analytics Graphs Overlaying Urban Skyline Conceptual Art Image

Digital Analytics Graphs Overlaying Urban Skyline Conceptual Art

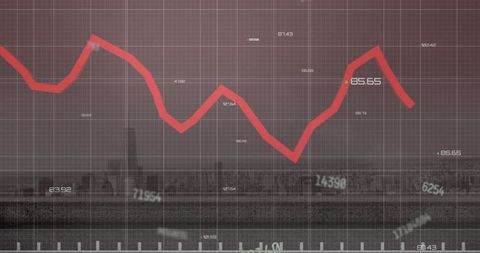
This illustration shows a red line graph depicting data trends over a prominent cityscape, highlighting concepts of technology and statistics in urban environments. Useful for presentations on economic trends, digital analysis, city analytics projects, or industry-level reports on data science and fin-tech advancements.

Powered by Shutterstock logo - Get 15% off with code: PIKWIZARD15
African Businesswoman Using Analytics Data KPI Dashboard Tech - Powered by Shutterstock - Get 15% off with code: PIKWIZARD15An analyst uses a computer and dashboard for data business analysis and Data Management System with KPI and metrics connected to the database for technology finance, operations, sales, marketing  - Powered by Shutterstock - Get 15% off with code: PIKWIZARD15Hand holding smartphone displays data visualizations, including histogram and pie chart. Analytics, digital transformation and increasing use of mobile technology in business. Minimalist art collage. - Powered by Shutterstock - Get 15% off with code: PIKWIZARD15Business finance data analytics graph.Financial management technology.Advisor using KPI Dashboard on virtual screen. - Powered by Shutterstock - Get 15% off with code: PIKWIZARD15Data analytics and insights powered by big data and artificial intelligence technologies. Data scientist working with complex information analysed by AI for business analytics dashboard with charts. - Powered by Shutterstock - Get 15% off with code: PIKWIZARD15

Credit Photo

If you would like to credit the Photo, here are some ways you can do so

Free (free of charge)

Free for personal and commercial use.

Author: Creative Art

Similar Free Stock Images

Digital Data Processing Interface with Code and Graph
Premium
Business finance data analytics graph chart report, man using laptop computer hand typing investment data digital marketing KPI sale report, financial management technology, cyber space metaverse.
Red Line Graph Over Histogram Representing Financial Volatility
Financial Data Charts with World Map on Blue Digital Background
Digital Financial Data Analyzing Over Circular Grid Display
Rising Digital Graph and Data Visualizations on Black Background
Premium
Stock market or forex trading graph on touchscreen,  finance and investment concept. Economy trends for business, financial charts and digits.
Green Line Rising on Digital Trading Board with Abstract Background
Digital Financial Data Analysis with Growth Chart
Financial Graph Analysis on Green Grid Background
Futuristic Financial Data Visualization on Digital Interface
Premium
Analyst working with Business, Concept digital transformation technology strategy, Analytics and Data Management System on computer, make a report with KPI and metrics connected to database.
Digital Fingerprint with Graph on Data Interface
Dynamic Financial Data Visualizations on Grid Interface
Green Financial Line Chart Over Modern Office Buildings
Digital Finance Chart Overlaying Globe Background
Premium
Big data analytics with AI technology. Data analyst analyzing and visualizing complex information network with artificial intelligence. Machine learning algorithm for business analytics and finance.
Digital Data Visualization with Trend Lines and Percentage Changes
Financial Data Analysis in Digital Interface with Graphs
Rising Graph Line on Digital Green Grid Background
Digital Data Processing Interface with Green Growth Chart
Premium
Analysis finance grow graph and market  investment. Financial  business plan,earnings,sale and strategy. Stock market chart, exchange financial growth diagram.
Binary Code and Financial Data on Digital Screen
Data Analysis Graphics on Digital Grid Background
Dynamic Financial Graphs Overlaying Modern Cityscape
Line Graph Illustrating Data Trend on Green Digital Background
Premium
Data analytics report and key performance indicators on information dashboard for Business strategy and business intelligence.
Dynamic Financial Data on Dark Background With Colorful Graphs
Analyzing Growing Graph Line on Purple Gradient Background
Green Line Graph on Dark Digital Grid
Digital Graphs and Data Visualization on Green Background
Digital Interface with Data Processing Visualization
Digital Financial Data Overlaying City Skyline at Dusk
Premium
Analyst working with Financial Data and Business Analytics Dashboard on computer to make Financial Report with KPI and Metrics. Investment, Corporate Finance, Strategy, Operations, Sales.
Financial Data Flow against Urban Skyline Backdrop
Digital Financial Data Display with Graph and Grid
Digital Interface Showing Global Business Data Analytics
Digital Finance: Modern Stock Market Analysis Display
Premium
Businessman using KPI dashboard.Financial business KPI System data analytics graph dashboard.Data System KPI and metrics connected in database for follow earnings,operations and sales data.
Futuristic Graph and Data Visualization Interface Design
Cryptocurrency Growth Chart Over Digital World Map
Dynamic Financial Growth Digital Chart Display
Financial Market Growth Over City Skyline
Premium
Business finance data analytics graph.Financial management technology.Advisor using KPI Dashboard on virtual screen.
Green Financial Line Graph with Candlestick Data on Grid Background
Declining Graph Overlay on Night Traffic Scene Illustrates Downtrend
Financial Graphs Displaying Business Trends on Grid Background
Dynamic Data Display Generating Business Growth Analysis
Premium
Data analyst working on business analytics dashboard with charts, metrics and KPI to analyze performance and create insight reports for operations management.
Financial Data Analysis with Team Collaboration in Office
Rising Financial Data Graph on Digital Grid Background
Dynamic Data Chart on Dark Digital Background
Dynamic Green Line Graph Depicting Financial Data
Premium
AI-Driven Workflow, Automating Data Management Analytics and Business Reports with KPIs, Predictive Insights, and Big Data Integration. Businessman touching Virtual Screen with Decision-Making Tech.
Dynamic Financial Chart with Red Line Graph on Digital Interface
Financial Data Analysis with Interactive Graphs
Digital Stock Market Graph with Abstract Coding Background
Green Line Graph with Data Points on Grid Background
Premium
Business finance data analytics graph chart report, man using mobile tablet searching investment data digital GDP marketing KPI sale report, financial management technology, virtual screen metaverse.
Abstract Digital Data Graph and Diagrams on Gray Background
Dynamic Financial Stock Market Analysis Display
Digital Stock Market Graph Red Trendline on Green Background
Data Analysis Process with Green Digital Interface
Financial Graph and Cityscape Analysis with Technological Overlay
Declining Graph with 49% Reduction on Dark Digital Background
Premium
Business finance data analytics graph.Financial management technology.Advisor using KPI Dashboard on virtual screen.
Dynamic Financial Graphs Illustrating Market Trends
Digital Interface with Global Financial Graphs Background
Fluctuating Digital Stock Market Data Chart
Abstract Financial Chart Background with Bar and Line Graphs
Premium
Online trading, Investment, Strategy market plan, and Stock mark
Analyzing Data Trends on Digital Graph Interface
Dynamic Green Line Graph Showing Financial Data Fluctuations
Growth Trend with Green Line Overlay and Modern Cityscape
Abstract Digital Finance Chart Showing Fluctuating Graph Lines
Premium
KPI Business Analytics Data Dashboard. Analyst Using Computer
Digital Stock Market Green Graph Against Dark Trading Board
Falling Business Graph on Green Digital Background
Digital Lock with Real-Time Data Display
Abstract Digital Data with Upward Trending Line Graph
Premium
Analytics Finance and Business concept. Big data analytics and business intelligence BI.
Green Data Graph on Black Digital Interface
Dynamic Financial Data Representation on Digital Grid
Declining Stock Market Graph with Red Trend Line
Binary Code Financial Analytics with Rising Graph Line
Premium
Trader analyzing data on virtual screen.Price graph and indicator. Stock market invest and crypto currency. Stock market and business investment.
Cityscape with Digital Stock Market Graphs and Statistics
Green Line Graph Overlapping Data Server Racks in Technology Center
Green Graph Showing Forex Trends on Transparent Cyber Interface
Fluctuating Financial Graph on Green Grid Background
Premium
Dashboard finance management on laptop computer analyzing sales data and growth graph chart report. Business planning, strategy and development. Financial accounting. market research, data analysis
Financial Growth Stock Nikkei in Urban City Skyline
Digital Green Line Graph Over Grid with Statistics and Numbers
Digital Currency Trading Interface with Data Visualization
Dynamic Financial Data Visualization over Urban Silhouette
Economic and Political Factors Influence Investment Trends
Data Recovery Progress Display on Digital Interface
Premium
Smart businessman hand close up NFT financial data on mobile laptop futuristic stock chart graphic, Business investor stock exchange market and crypto currency data analytics digital technology
Abstract Financial Chart Over Modern Cityscape
Innovative Data Analysis with Dynamic Line Graph and Digital Elements
Digital Data Analysis with Green Line Graph on Grid Background
Financial Data Line Graph on Digital Display
Premium
Business Professional Using KPI Dashboard and Digital Analytics Tools for Strategic Planning, Performance Management, and Success Goals
Dynamic Stock Market Graphs Over Digital Interface
Data Analytics Graphs on Digital Interface Background
Declining Financial Market Chart Over Grid Background
Rising Green Line Chart Overlays Concept of Financial Growth
Premium
Finance analyst working on business analytics and data management system to make financial report with business performance, KPI dashboard. Corporate strategy for finance, digital marketing plan
Digital Financial Data and Global Market Analysis on Graph
Business Women Analyzing Data in Office with Growth Chart Overlay
Data Analysis with Advanced Technology Interface Details Profusion
Abstract Data Visualization with Dynamic Charts and Graphs
Premium
Businessman using laptop computer analyzing sales data and financial growth graph chart report. Business planning, strategy and development. Financial accounting. market research, data analysis
Financial Growth Chart with Dynamic Green Line on Grid Overlay
Cybersecurity Concept with Declining Data Graph and Digital Shield
Digital Data Analysis over Cityscape Stock Market Concept
NFT Financial Data Visualization with Digital Graph Overlay
Premium
Businesswomen use magnifier glass find stock in stock markets, uptrends, growth economics, business strategy development, and opportunities for investment, take profit from funds, Financial Analyst.
Dynamic Red Line Graph With Data Points on Gridded Background
Dynamic Financial Data Overlaid on Grid Background
Fluctuating Financial Graph on Digital Orange Background
Dynamic Financial Data Chart Showing Trend Analysis
Premium
Business finance data analytics graph.Financial management technology.Advisor using KPI Dashboard on virtual screen.
Digital Financial Chart with Green Trend Line on Grid Background