
- Home >
- Stock Photos >
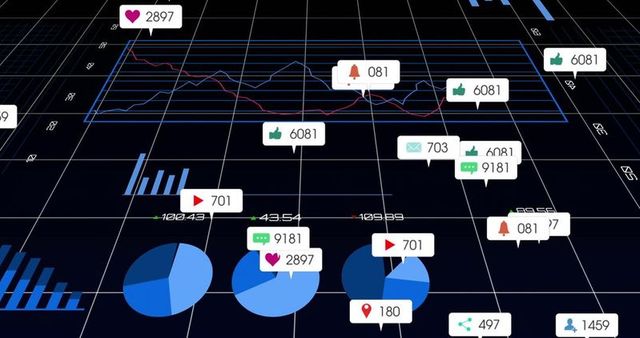
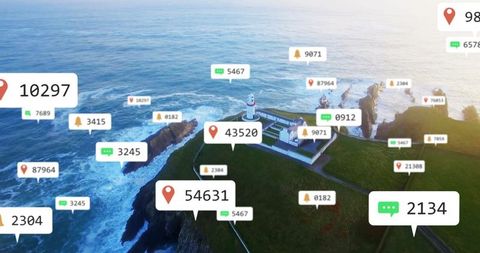
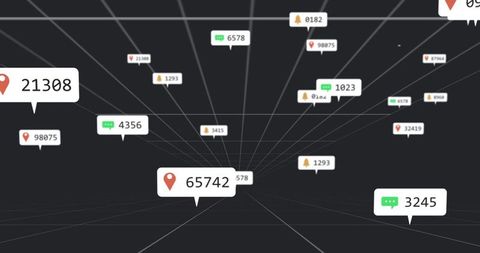
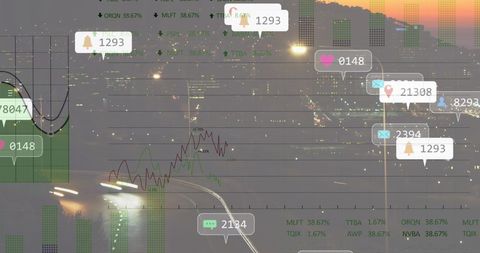
- Digital Analytics Interface Highlighting User Engagement Statistics
Digital Analytics Interface Highlighting User Engagement Statistics Image

Depicting dashboard congested with digital analytics, the image focuses on clusters of notification icons indicating various user interactions and statistics. It serves as a robust visualization of complex user engagement metrics typically used in monitoring digital trends and preferences. Useful for websites, presentations, reports on digital marketing trends, and analytics tool descriptions to illustrate data-driven insights and technological advancements.
Powered by 


downloads
Tags:
More
Credit Photo
If you would like to credit the Photo, here are some ways you can do so
Text Link
photo Link
<span class="text-link">
<span>
<a target="_blank" href=https://pikwizard.com/photo/digital-analytics-interface-highlighting-user-engagement-statistics/e906468442a2a63b418a1fb91ab5c3af/>PikWizard</a>
</span>
</span>
<span class="image-link">
<span
style="margin: 0 0 20px 0; display: inline-block; vertical-align: middle; width: 100%;"
>
<a
target="_blank"
href="https://pikwizard.com/photo/digital-analytics-interface-highlighting-user-engagement-statistics/e906468442a2a63b418a1fb91ab5c3af/"
style="text-decoration: none; font-size: 10px; margin: 0;"
>
<img src="https://pikwizard.com/pw/medium/e906468442a2a63b418a1fb91ab5c3af.jpg" style="margin: 0; width: 100%;" alt="" />
<p style="font-size: 12px; margin: 0;">PikWizard</p>
</a>
</span>
</span>
Free (free of charge)
Free for personal and commercial use.
Author: Awesome Content
Similar Free Stock Images

Premium


Premium


Premium

Premium


Premium


Premium


Premium

Premium

Premium


Premium


Premium

Premium


Premium


Premium

Premium


Premium


Premium

Premium


Premium


Premium


Premium


Premium


Premium


Premium


Premium

Explore More Free Stock Images