
- Home >
- Stock Photos >
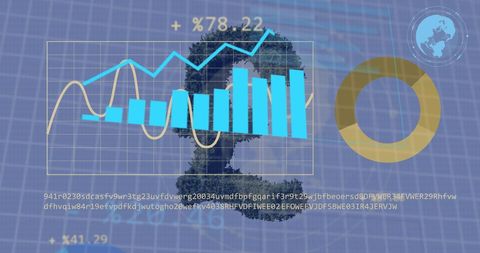
- Digital Analytics Interface on Grid Background Representing Business Data Trends
Digital Analytics Interface on Grid Background Representing Business Data Trends Image

Infographic showing business analytics with layered charts and data dashboards on a grid background. Useful for presentations on digital trends in business, technological advancements in data visualization, and strategic marketing discussions. Ideal for companies unveiling interactive data analytics processes or educational materials illustrating basic statistical application.
Powered by 


downloads
Tags:
More
Credit Photo
If you would like to credit the Photo, here are some ways you can do so
Text Link
photo Link
<span class="text-link">
<span>
<a target="_blank" href=https://pikwizard.com/photo/digital-analytics-interface-on-grid-background-representing-business-data-trends/5de46cf53d767df390880bd13cb79ddc/>PikWizard</a>
</span>
</span>
<span class="image-link">
<span
style="margin: 0 0 20px 0; display: inline-block; vertical-align: middle; width: 100%;"
>
<a
target="_blank"
href="https://pikwizard.com/photo/digital-analytics-interface-on-grid-background-representing-business-data-trends/5de46cf53d767df390880bd13cb79ddc/"
style="text-decoration: none; font-size: 10px; margin: 0;"
>
<img src="https://pikwizard.com/pw/medium/5de46cf53d767df390880bd13cb79ddc.jpg" style="margin: 0; width: 100%;" alt="" />
<p style="font-size: 12px; margin: 0;">PikWizard</p>
</a>
</span>
</span>
Free (free of charge)
Free for personal and commercial use.
Author: Creative Art
Similar Free Stock Images

Premium


Premium


Premium


Premium


Premium


Premium


Premium


Premium

Premium


Premium


Premium


Premium


Premium


Premium

Premium


Premium


Premium


Premium


Premium


Premium


Premium


Premium


Premium


Premium


Premium

Explore More Free Stock Images