- Home >
- Stock Photos >
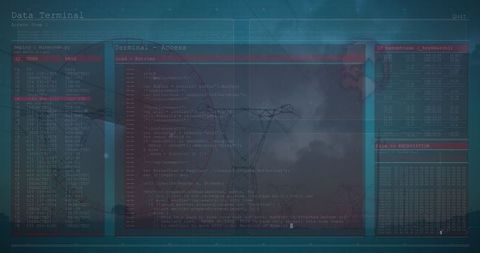
- Digital Analytics Interface with Translucent Wireframe Graph
Digital Analytics Interface with Translucent Wireframe Graph Image

Displays a translucent wireframe graph showcasing dynamic analytics on a digital interface. Bar chart at the forefront illustrates financial data trends prominently highlighted at 38.67%. Binary code and financial tickers subtly integrate into the background, emphasizing a technologically advanced data representation. This is ideal for use in contexts related to data visualization, financial reports, technology features, presentations in fintech, or interfaces in data management software designs.

downloads
Tags:
More
Credit Photo
If you would like to credit the Photo, here are some ways you can do so
Text Link
photo Link
<span class="text-link">
<span>
<a target="_blank" href=https://pikwizard.com/photo/digital-analytics-interface-with-translucent-wireframe-graph/7926cc6863cb8ca6c222b89094aa435e/>PikWizard</a>
</span>
</span>
<span class="image-link">
<span
style="margin: 0 0 20px 0; display: inline-block; vertical-align: middle; width: 100%;"
>
<a
target="_blank"
href="https://pikwizard.com/photo/digital-analytics-interface-with-translucent-wireframe-graph/7926cc6863cb8ca6c222b89094aa435e/"
style="text-decoration: none; font-size: 10px; margin: 0;"
>
<img src="https://pikwizard.com/pw/medium/7926cc6863cb8ca6c222b89094aa435e.jpg" style="margin: 0; width: 100%;" alt="" />
<p style="font-size: 12px; margin: 0;">PikWizard</p>
</a>
</span>
</span>
Free (free of charge)
Free for personal and commercial use.
Author: People Creations