
- Home >
- Stock Photos >
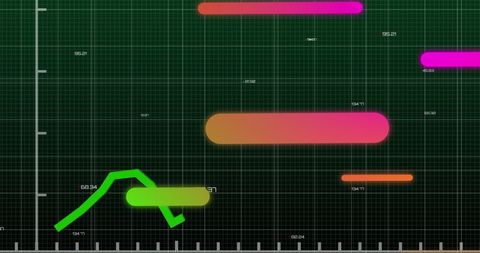
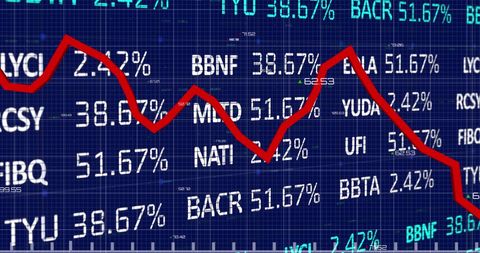
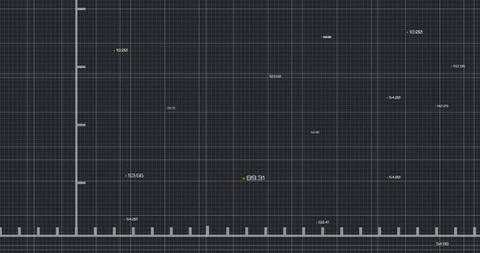
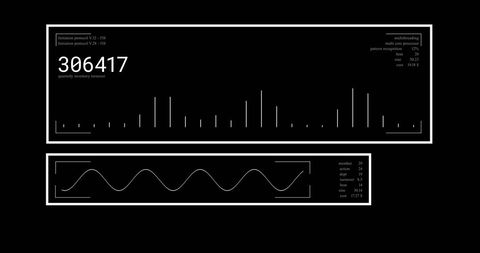
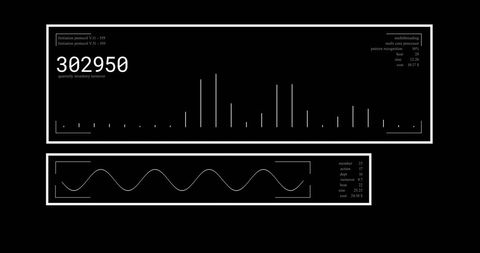
- Digital Analytics Interface with Vibrant Data Display
Digital Analytics Interface with Vibrant Data Display Image

Dynamic representation of digital statistics and financial data used in business technology applications. Design evokes modern interfaces suitable for presentations, academic usage, or large-scale enterprise data systems providing visualized analytics insights.
Powered by  - Get 15% off with code: PIKWIZARD15


downloads
Tags:
More
Credit Photo
If you would like to credit the Photo, here are some ways you can do so
Text Link
photo Link
<span class="text-link">
<span>
<a target="_blank" href=https://pikwizard.com/photo/digital-analytics-interface-with-vibrant-data-display/17b8495cbb2efdc1e97448e89ea4db81/>PikWizard</a>
</span>
</span>
<span class="image-link">
<span
style="margin: 0 0 20px 0; display: inline-block; vertical-align: middle; width: 100%;"
>
<a
target="_blank"
href="https://pikwizard.com/photo/digital-analytics-interface-with-vibrant-data-display/17b8495cbb2efdc1e97448e89ea4db81/"
style="text-decoration: none; font-size: 10px; margin: 0;"
>
<img src="https://pikwizard.com/pw/medium/17b8495cbb2efdc1e97448e89ea4db81.jpg" style="margin: 0; width: 100%;" alt="" />
<p style="font-size: 12px; margin: 0;">PikWizard</p>
</a>
</span>
</span>
Free (free of charge)
Free for personal and commercial use.
Author: Creative Art
Similar Free Stock Images

Premium


Premium


Premium


Premium


Premium

Premium


Premium


Premium


Premium


Premium


Premium


Premium


Premium

Premium


Premium


Premium


Premium


Premium


Premium


Premium


Premium


Premium


Premium


Premium


Premium

Explore More Free Stock Images