
- Home >
- Stock Photos >
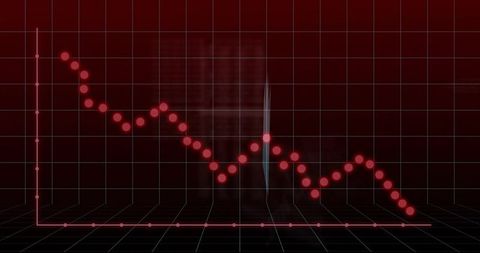
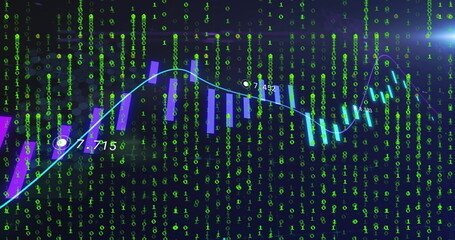
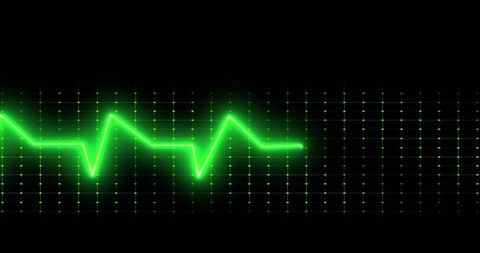
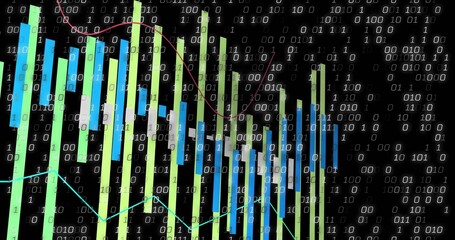
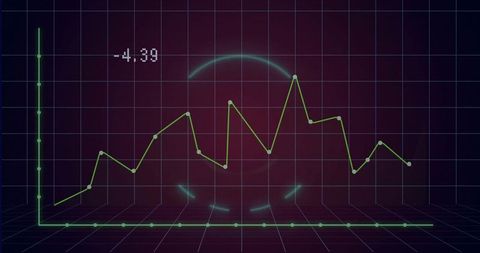
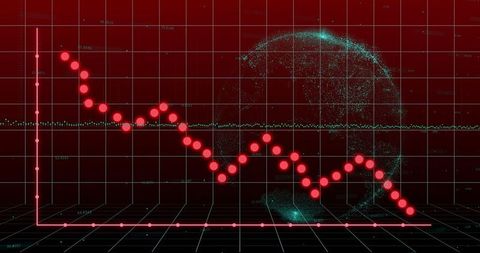
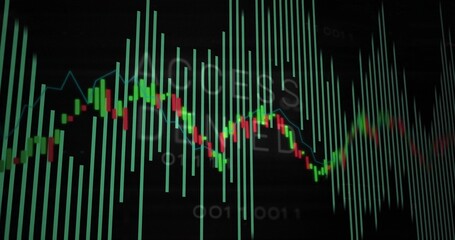
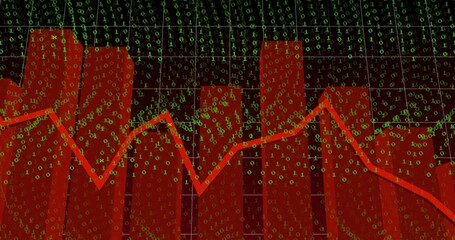
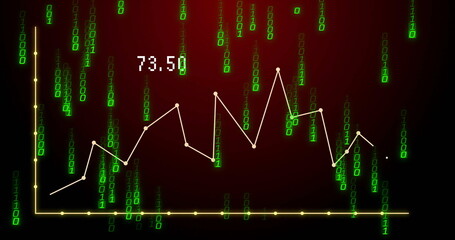
- Digital Analytics with Binary Data and Green Chart Line
Digital Analytics with Binary Data and Green Chart Line Image

Green line chart set on a dark, digital background featuring steady streams of binary code symbols. The fluctuating line represents analytics and data studies, providing a visually impactful idea of monitoring trends and patterns. Ideal for illustrating concepts related to technology, digital data insights, future innovations, network analysis, and cyber information presentations.
Powered by 


downloads
Tags:
More
Credit Photo
If you would like to credit the Photo, here are some ways you can do so
Text Link
photo Link
<span class="text-link">
<span>
<a target="_blank" href=https://pikwizard.com/photo/digital-analytics-with-binary-data-and-green-chart-line/ba45c21f0ddc1456e3210ab36710076b/>PikWizard</a>
</span>
</span>
<span class="image-link">
<span
style="margin: 0 0 20px 0; display: inline-block; vertical-align: middle; width: 100%;"
>
<a
target="_blank"
href="https://pikwizard.com/photo/digital-analytics-with-binary-data-and-green-chart-line/ba45c21f0ddc1456e3210ab36710076b/"
style="text-decoration: none; font-size: 10px; margin: 0;"
>
<img src="https://pikwizard.com/pw/medium/ba45c21f0ddc1456e3210ab36710076b.jpg" style="margin: 0; width: 100%;" alt="" />
<p style="font-size: 12px; margin: 0;">PikWizard</p>
</a>
</span>
</span>
Free (free of charge)
Free for personal and commercial use.
Author: Creative Art
Similar Free Stock Images

Premium


Premium


Premium


Premium


Premium


Premium


Premium


Premium


Premium


Premium


Premium


Premium


Premium


Premium

Premium


Premium


Premium


Premium


Premium

AI


Premium


Premium


Premium


Premium


Premium


Premium

Explore More Free Stock Images